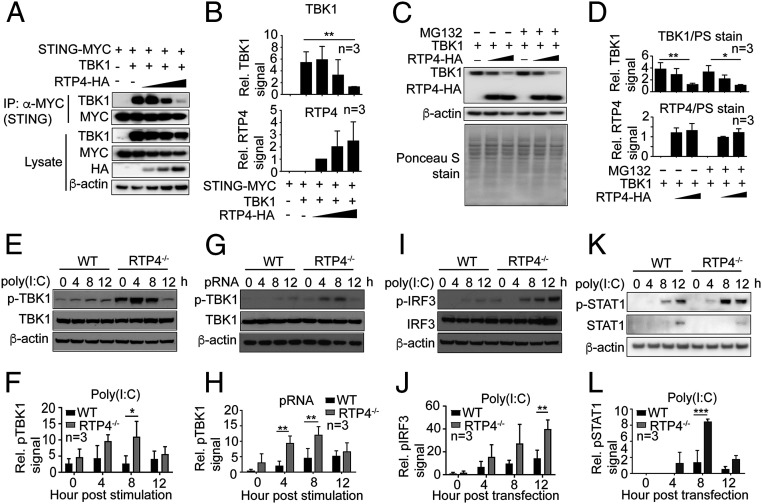
Fig. 5.
RTP4 impairs interaction of STING with TBK1 and phosphorylation of TBK1, IRF3, and STAT1. (A) The co-IP of STING and TBK1 in the presence of increasing amounts of RTP4 (50, 100, and 200 ng plasmid). The 293T cells (1 × 10⁶) were transfected with plasmids encoding RTP4-HA, STING-MYC (500 ng), and TBK1 (500 ng). Proteins were pulled down using anti-MYC and detected with anti-TBK1 (dilution 1:1,000) or anti-MYC (dilution 1:1,000) antibodies. Protein expression in cell lysates was also detected using the same antibodies as well as anti-HA (dilution 1:1,000). (B) Plots of scanned signals of TBK1 and RTP4 from A after adjusting for protein loading (β-actin) and TBK1 or RTP4 protein expression in the lysates. (C and D) TBK1 and RTP4 protein levels by western blot (C) and plots (D) of scanned signals from C with or without MG132 treatment (10 μM) for 6 h. The 293T cells (1 × 10⁶) were transfected with plasmids encoding TBK1 (500 ng) and RTP4-HA (0 ng, 500 ng, and 1.0 μg), and proteins were detected using anti-TBK1 and anti-HA. Ponceau S-stained total proteins and β-actin were used as protein loading controls. (E) Western blot detection of TBK1 protein expression and phosphorylation from 1 × 10⁶ WT or Rtp4−/− cells after poly(I:C) (1.5 μg) stimulation. (F) Plot of scanned signals of TBK1 phosphorylation from E after adjusting for protein loading (β-actin) and TBK1 expression. (G and H) The same experiment as in E and F after pRNA (5 μg) stimulation. (I and J) The same experiment as in E and F but for pIRF3 levels. (K–L) The same experiment as in E and F but for pSTAT1 levels. Note: Proteins in E and I were from the same protein preparations, and only one β-actin loading control was performed. Two-way ANOVA, mean and SD (n = 3); *P < 0.05; **P < 0.01; ***P < 0.001. All of the experiments were independently repeated at least three times with similar results.

