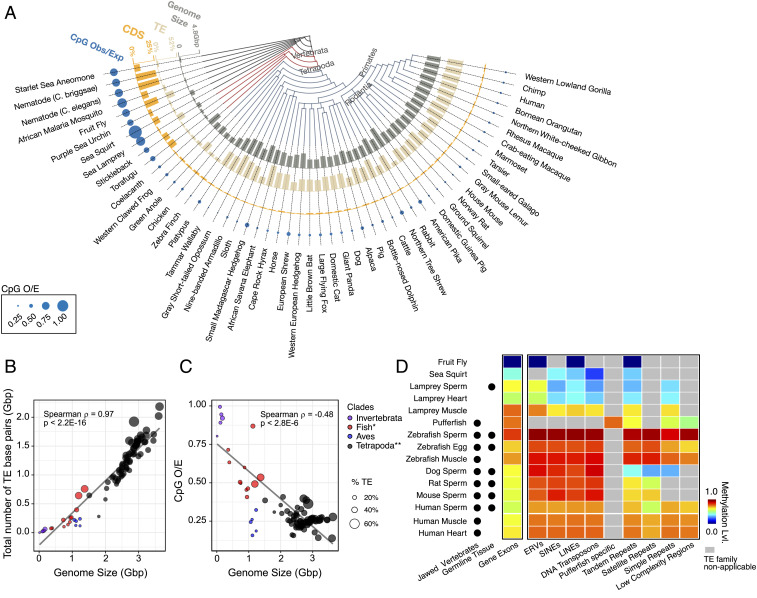
Fig. 2.
DNA methylation enabled genome expansion via TEs in higher-order vertebrates. (A) Genome size (billion bp), % TE, % coding sequence (CDS), and CpG O/E ratio, shown on a taxonomy tree. (B) Total number of TE bases versus genome size. (C) CpG O/E ratio versus genome size. *Fish includes Actinopterygii (ray-finned fishes), Chondrichthyes (cartilaginous fishes), and lamprey (a jawless fish) but not coelacanth. **Although part of Tetrapoda, birds (Aves) are colored separately. (D) Average methylation levels of gene exons and TEs in different organisms.

