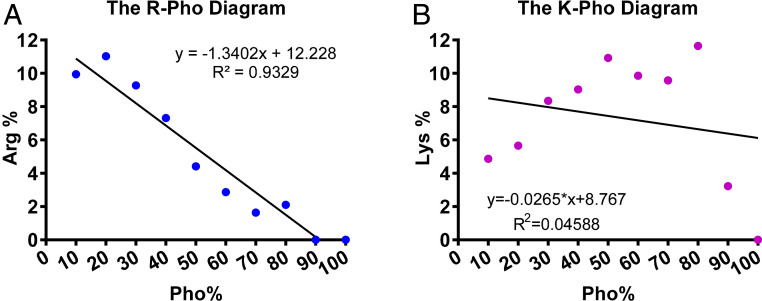
Fig. 1.
Relationships between averaged net charge and hydrophobic residue content. (A) A linear correlation between hydrophobic residue content (Pho) and arginine content (R) of AMPs based on 3,177 peptides in the current APD (6). (B) There is no such correlation between lysine contents and Pho. The peptides in the APD (6) were separated into 10 bins based on hydrophobic contents (0–10, 11–20, 21–30, 31–40, 41–50, 51–60, 61–70, 71–80, 81–90, and 91–100%), which are represented as 10, 20, 30, 40, 50, 60, 70, 80, 90, and 100 on the x axis of this plot. These relationships remained the same from 2017 to 2020. Data were obtained from the APD in March 2020.

