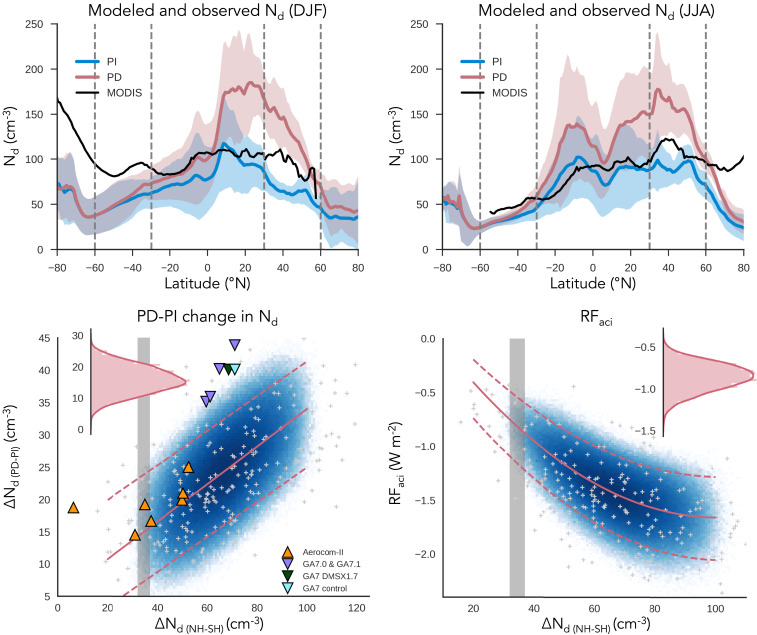
Fig. 1.
Constraints on aci from satellite estimated hemispheric contrast in Nd over oceans (∆Nd(NH-SH)). (A and B) Oceanic PI (blue) and PD (red) Nd modeled by Aerocom-II models and HadGEM3-GA7.1 development models. Thick lines show the multimodel mean, and corresponding shading shows the SD across models. (A and B) Data from (A) December through February (DJF) and (B) June through August (JJA). In SO winter, the Aerocom-II National Center for Atmospheric Research models are missing data due to lack of low, liquid cloud, leading to discontinuity in the multimodel mean at 70°S. Zonal means from each model are shown in SI Appendix, Fig. S1. ∆Nd(NH-SH) is calculated as the difference in annual, area-weighted mean Nd over the ocean between 30°N to 60°N and 30°S to 60°S (averaging boundaries shown as vertical dashed lines). (C) Change in oceanic Nd between the PI and PD (∆Nd(PD-PI)) as a function of ∆Nd(NH-SH) in PPE members (gray crosses for individual model members, blue shading for Nd values sampled from a statistical emulator), in Aerocom-II (orange triangles), and HadGEM-GA7.1 development models (purple, blue, and dark green triangles). HadGEM-GA7.0 with enhanced DMS is shown in dark green and the control HadGEM-GA7.0 in blue. The linear fit to the PPE data and 95% prediction bands on the fit are shown as red solid and dashed lines. The 95% confidence on the interannual range of ∆Nd(NH-SH) estimated by MODIS is shown in gray. (D) As in C but showing the relation between RFaci and the hemispheric contrast calculated from the PPE sample members along with a second-order polynomial fit between ∆Nd(NH-SH) and RFaci. (Insets) The PDF of the emulated PPE member values within the observationally constrained range of ∆Nd(NH-SH) (C) for ∆Nd(PD-PI) and (D) for RFaci.

