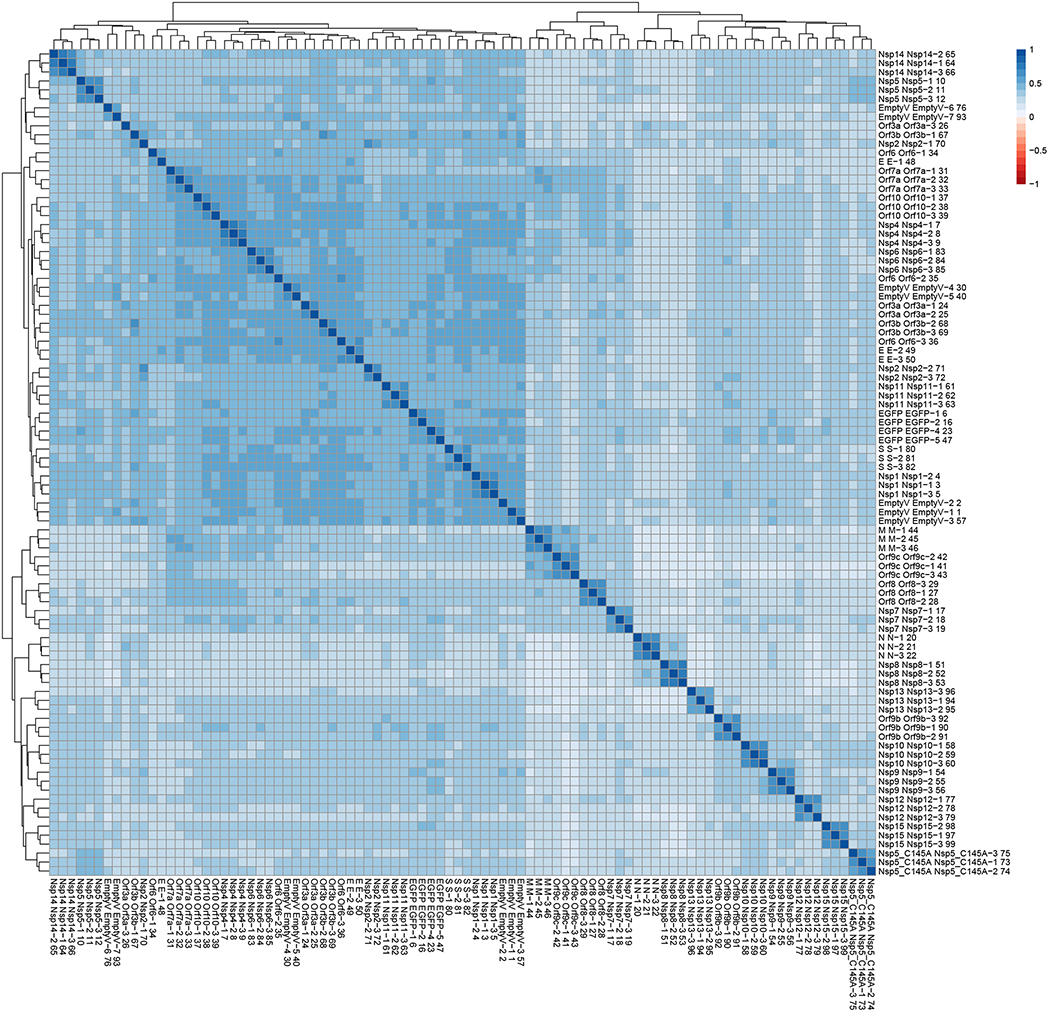
Extended Data Figure 2. Clustering analysis of AP-MS dataset reveals biological replicates of individual baits are well correlated.
All MS runs (n=3 biologically independent samples, run in replicates) were compared and clustered using artMS (David Jimenez-Morales, Alexandre Rosa Campos, and John Von Dollen, and Nevan Krogan. (2019). artMS: Analytical R tools for Mass Spectrometry. R package version 1.3.9. https://github.com/biodavidjm/artMShttps://github.com/bio-davidjm/artMS). This figure depicts all Pearson’s pairwise correlations between MS runs, and is clustered according to similar correlation patterns. Correlation between replicates for individual baits ranges from 0.46–0.72, and in most cases the experiments corresponding to each bait cluster together, with the exception of a couple of baits with lower numbers of specific host interactions (e.g. E, Nsp2, Orf6, Orf3a, and Orf3b).

