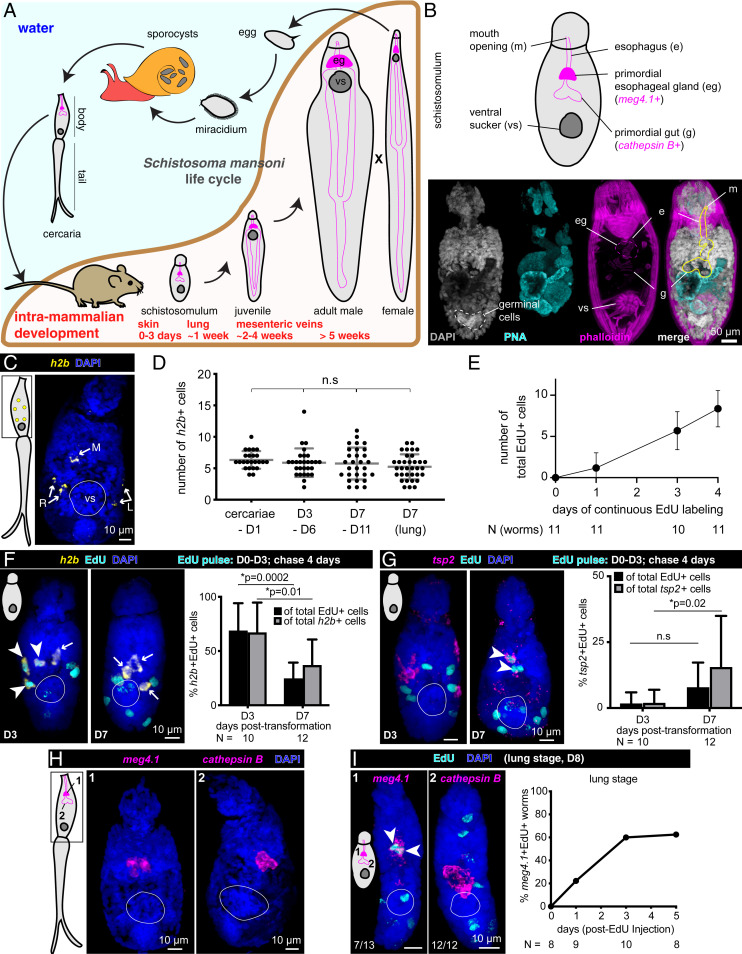
Fig. 1.
Stem cells drive early development of the schistosome esophageal gland. (A) Life cycle of Schistosoma mansoni. eg, esophageal gland; vs, ventral sucker. Each worm schematic depicts the esophageal gland (magenta-filled bean shapes), gut branches that stretch posteriorly (magenta outlines), and the ventral sucker (dark gray disk). The intramammalian developmental curve was adapted from ref. 40. (B) Anatomical features of schistosomula. (Top) Schematic view of a schistosomulum with the primordial digestive tract outlined. Genes expressed in distinct parts of the digestive tract are indicated. (Bottom) Day 1 posttransformation schistosomulum stained with PNA lectin and phalloidin, maximum-intensity projection (MIP). PNA (cyan) labels cercarial penetration gland used for mammalian skin penetration; this gland is largely unused after mechanical removal of tails. Phalloidin staining (magenta) labels muscular features surrounding the primordial digestive tract. (C) h2b fluorescence in situ hybridization (FISH) in cercaria, MIP. R and L, right and left, each showing pairs of h2b+ stem cells; M, medially located stem cell. vs, ventral sucker, indicated by white circles throughout (C–I). (D) Quantification of h2b+ cells in cercariae and schistosomula at various time points in vitro and in vivo (lung) (SI Appendix, Fig. S1A). Gray lines: Mean ± SD. Statistical analysis: one-way ANOVA. (E) Quantification of EdU+ cells at indicated days posttransformation after continuous EdU labeling in vitro. Mean ± SD. (F, Left) h2b FISH and EdU labeling at day 3 or 7 posttransformation in vitro, MIP. Arrowheads: double-positive cells; Arrows: h2b+ EdU− cells. (Right) Percent of h2b+ EdU+ cells over total EdU+ cells (black) or h2b+ cells (gray); mean ± SD. (G, Left) tsp2 FISH and EdU labeling as in F. Arrowheads: double-positive cells; Arrows: tsp2+ EdU− cells. (Right) Percentage of tsp2+ EdU+ cells over total EdU+ cells (black) or total tsp2+ cells (gray); mean ± SD. (H) cathepsin B (gut primordia) and meg4.1 (esophageal gland) FISH in cercariae. (I, Left) cathepsin B and meg4.1 FISH in lung-stage schistosomula (day 8 postinfection) 5 d after a single EdU injection into host on day 3, MIP. (Right) Percentage of worms with meg4.1+ EdU+ cells.

