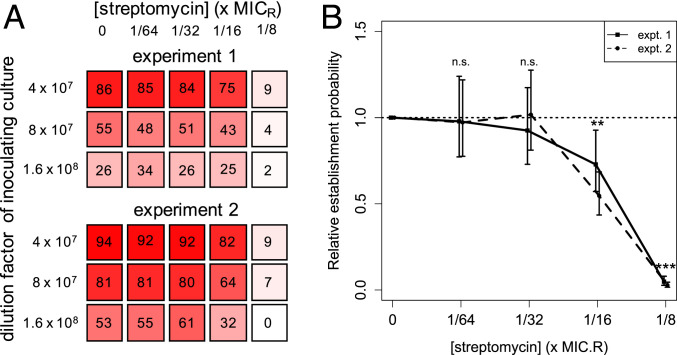
Fig. 2.
Establishment probability of single PA01:Rms149 streptomycin-resistant cells, estimated from seeding experiments. (A) Visual representation of the growth data, indicating the number of replicate cultures (out of 96) that grew in each test condition up to 3 d postinoculation. (B) Estimated relative per-cell establishment probability , scaled by the probability in streptomycin-free medium, as a function of streptomycin concentration, scaled by the standard MIC value of the resistant strain (MICR = 2,048 μg/mL; SI Appendix, Table S1). Results are shown for two separate experiments. Plotted points indicate the maximum-likelihood estimate of , and error bars indicate the 95% confidence interval, using the fitted model selected by the likelihood ratio test (experiment 1: model B′, fixed environmental effect; experiment 2: model C′, the null model [Eq. 1]. Both of these models pool data across three inoculation densities; see SI Appendix, Text, section 10, for details). Significance of the streptomycin effect is determined by fitting a generalized linear model to the population growth data (n.s.: not significant, P > 0.05; **P = 0.01 in experiment 1, P = 2e-7 in experiment 2, and P = 2e-8, pooling both experiments; ***P < 2e-16 in both experiments; see SI Appendix, Text, section 14.1, for full results).

