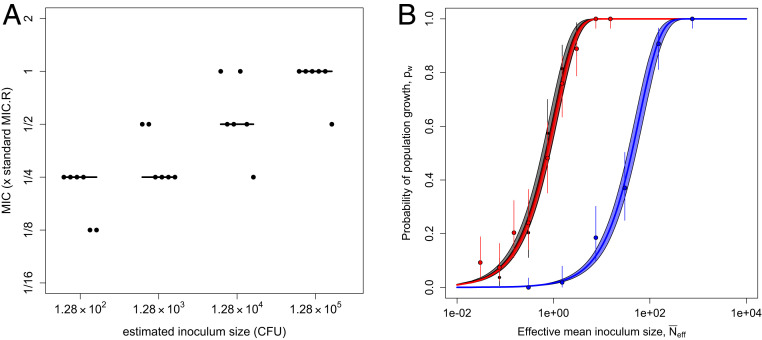
Fig. 3.
Inoculum size effects on MIC and probability of population growth of the resistant PA01:Rms149 strain in streptomycin. (A) MIC as a function of inoculum size. Cultures were inoculated with PA01:Rms149 at four different inoculum sizes. MIC was evaluated as the minimal tested streptomycin concentration that prevented detectable growth up to 3 d postinoculation; a qualitatively similar pattern arose if growth was evaluated at 20 h (SI Appendix, Fig. S2). The y axis is scaled by the MIC of this strain at standard inoculation density (MICR). The points represent six replicates at each inoculum size, with the line segments indicating their median. (B) Null model of the inoculum size effect (Eq. 1) fit to culture growth data. Probability of population growth (pw) is plotted as a function of effective mean inoculum size (, calibrated by the results in streptomycin-free media; SI Appendix, Fig. S4). Black: streptomycin-free; red: streptomycin at 1/16 × MICR; blue: 1/8 × MICR. These results are based on growth in streptomycin up to 5 d postinoculation; see SI Appendix, Text, section 15, for results at 3 d postinoculation. Points indicate the proportion of replicate cultures showing growth, i.e., the maximum-likelihood estimate (MLE) of pw in the full model, with error bars indicating the 95% confidence interval (CI). The solid line shows the best fit of the null model (i.e., Eq. 1 parameterized with the MLE of ), and the shaded area corresponds to the 95% CI. According to the likelihood ratio test, the null model deviance from the full model is not significant at any streptomycin concentration (streptomycin-free: P = 0.55; 1/16 × MICR: P = 0.28; 1/8 × MICR: P = 0.71; see SI Appendix, Text, section 15, for full results).

