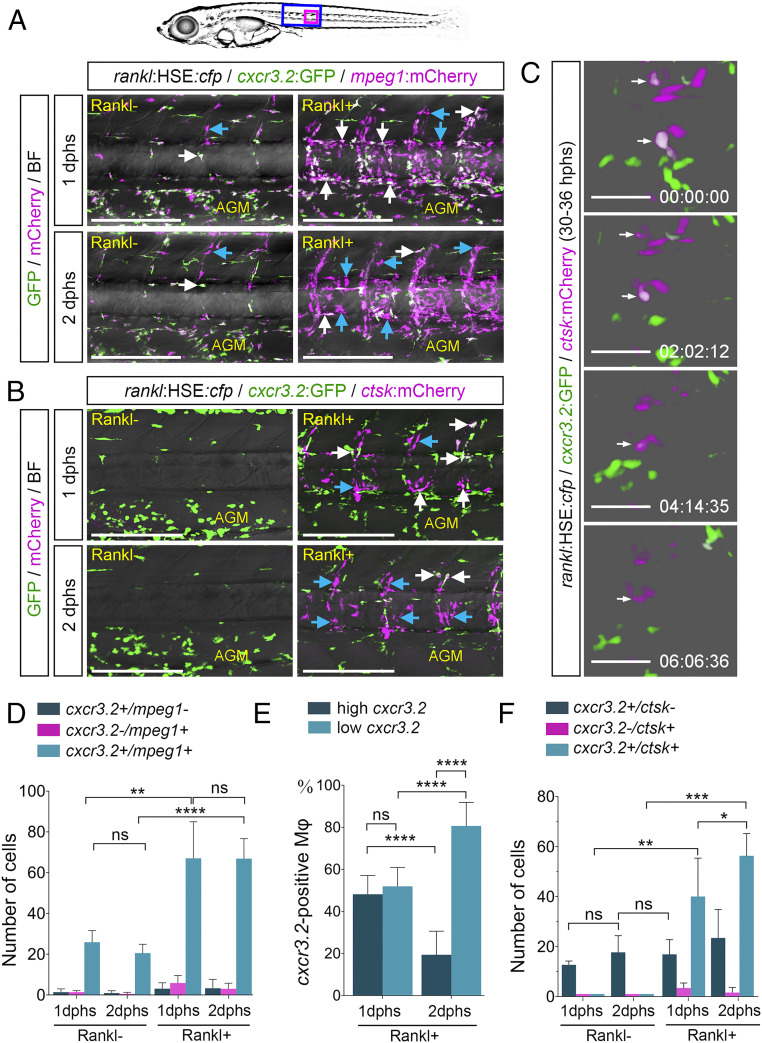
Fig. 2.
cxcr3.2:GFP is expressed in a subset of macrophages and osteoclasts. (A) Expression of cxcr3.2:GFP in a subset of mpeg1:mCherry-positive macrophages without and with Rankl induction, at 1 or 2 dphs. Coexpressing cells are labeled with white arrows, and blue arrows mark cxcr3.2:GFP-negative macrophages. (B) Expression of cxcr3.2:GFP in a subset of ctsk:mCherry-positive osteoclasts. Coexpressing cells are labeled with white arrows, and blue arrows mark cxcr3.2:GFP-negative osteoclasts. (C) Reduction of cxcr3.2:GFP expression during osteoclast maturation. Still images are taken from Movie S4. (D) Quantification of cxcr3.2 and mpeg1 single and double-positive cells. (E) Quantification of cxcr3.2:GFP expressing macrophages with low or high GFP expression. (F) Quantification of cxcr3.2 and ctsk single and double-positive cells. Error bars show mean value ± SD, Brown–Forsythe ANOVA with Games–Howell’s multiple comparisons test (D), one-way ANOVA with Tukey’s multiple comparisons test (E), and Mann–Whitney U test (F); ****P < 0.0001, ***P < 0.001, **P < 0.01, *P < 0.05; ns, nonsignificant; ncxcr3.2/mpeg1 = 34 fish, n cxcr3.2/ctsk = 7 fish. Time in C is hh:mm:ss. (Scale bars, 200 µm in A and B and 50 µm in C.)

