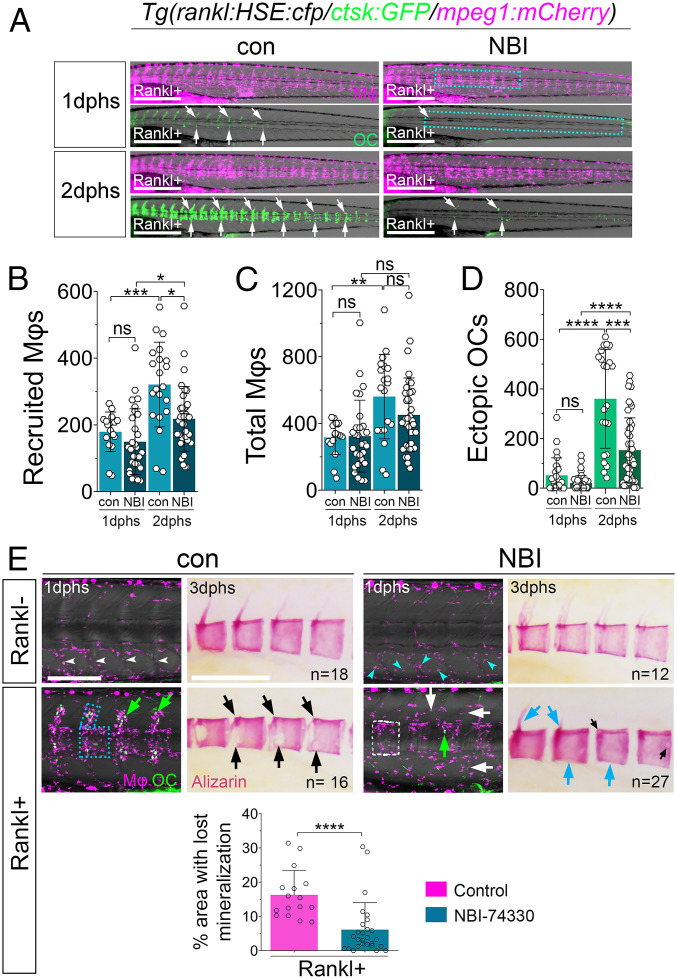
Fig. 4.
Cxcr3.2 inhibitor NBI-74330 interferes with macrophage recruitment and osteoclast differentiation. (A) Trunk regions of triple transgenic rankl:HSE:cfp/ctsk:GFP/mpeg1:mCherry larvae treated with DMSO (con) or NBI-74330 (NBI) for 3 h, followed by heat shock to induce Rankl and imaging at 1 and 2 dphs. ctsk osteoclasts are labeled with white arrows. (B–D) Quantification of recruited macrophages (B), total number of macrophages (C), and ectopic osteoclasts (D) in areas indicated by boxes in A. Data are represented as mean number of cells ± SD, *P < 0.05, **P < 0.01, ***P < 0.001, ****P < 0.0001; ns, nonsignificant, Brown–Forsythe ANOVA with Tukey’s multiple comparisons test, 17 ≤ NLarvae ≤ 36, from three independent experiments. (E) Confocal images of macrophages (Mφ; magenta) and osteoclasts (OC; green) in vertebral bodies. Without Rankl induction, macrophages are confined to myosepta in AGM of control larvae (con; white arrowheads), while they are dispersed in AGM of NBI-treated larvae (NBI; cyan arrowheads). After Rankl induction, macrophages and osteoclasts are located along neural arches and vertebral centra in control larvae (blue box and green arrows). In NBI-treated larvae, macrophages are located in centra but less confined to neural arches (white box and white arrows), and fewer osteoclasts are detectable (green arrow). Alizarin Red staining shows severe lesions of mineralized matrix in majority of control larvae after Rankl induction, with neural arches resorbed and large lesions in centra (black arrows). In contrast, mineralization defects were strongly reduced in NBI-treated larvae with persistent mineralized neural arches and intact centra (cyan arrows). Areas with absent mineralization in centra were quantified (SI Appendix, Fig. S7) and are depicted in bar graph at bottom; Mann–Whitney U test, ****P < 0.0001. (Scale bars, 500 μm in A and 200 μm in E.)

