Fig. 5.
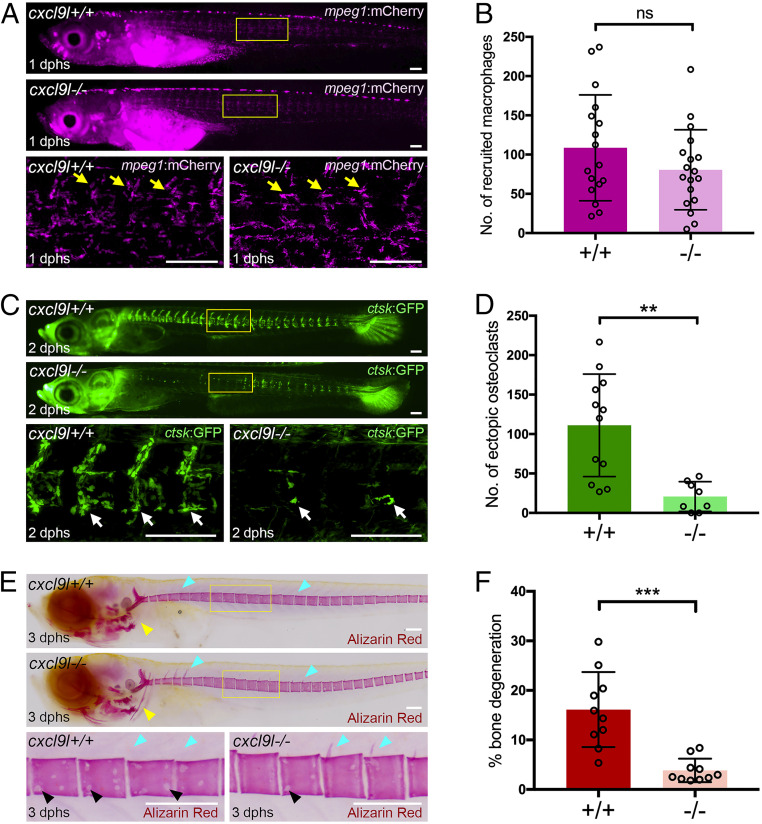
Impaired osteoclast formation and reduced bone lesions in cxcl9l mutants after Rankl induction. (A) Overview and high-magnification confocal images of cxcl9l+/+ and cxcl9l−/− siblings in mpeg1:mCherry/rankl:HSE:cfp transgenic background at 1 dphs (10 dpf). Similar recruitment of macrophages to centra (yellow arrows) in cxcl9l+/+ and cxcl9l−/− siblings at 1 dphs. (B) Quantification of mpeg1:mCherry macrophage numbers in vertebral column (region marked as boxes in A) in cxcl9l+/+ and cxcl9l−/− siblings at 1 dphs. (C) Overview and confocal images of ctsk:GFP-expressing osteoclasts (white arrows) in in cxcl9l+/+ and cxcl9l−/− siblings at 2 dphs. (D) Quantification of ctsk:GFP osteoclast numbers in vertebral column (region marked as boxes in C). (E) Overview and high-magnification views of Alizarin Red stained mineralized matrix in in cxcl9l+/+ and cxcl9l−/− siblings at 12 dpf (3 dphs). Wild-type siblings but not mutants show enhanced resorption of mineralized matrix at cleithrum (yellow arrowheads), neural arches (cyan arrowheads), and vertebral bodies (black arrowheads). (F) Quantification of bone lesions in vertebral column (position indicated by boxes in E; for method, see SI Appendix, Fig. S7). Error bars indicate mean ± SD, **P < 0.01, ***P < 0.001; ns, not significant, unpaired Student’s two-tailed t test. (Scale bars, 100 μm.)

