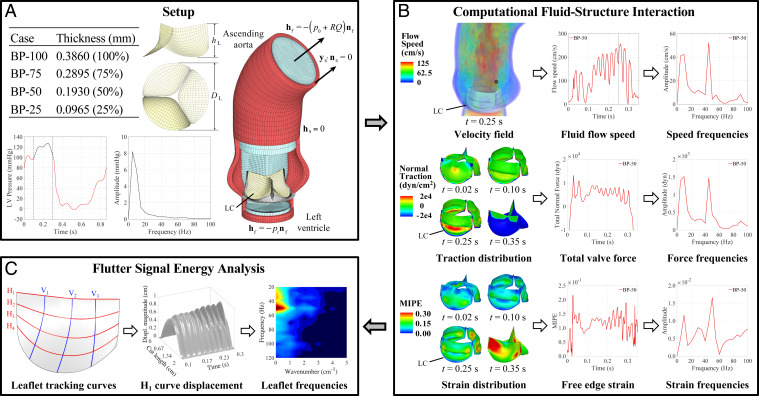
Fig. 1.
Overall schematic of the FSI-simulation and flutter-quantification methodologies. All results and analyses show the BP-50 case. The left coronary leaflet (LC) is indicated on each geometry. Further details can be found in Materials and Methods. (A) Valve thicknesses, ventricular pressure waveform, and problem setup for the computational simulation of the aorta and valve geometry. (B) FSI results and signal analysis procedure for the velocity field, leaflet normal tractions, and leaflet strains. The time signals of each quantity are analyzed using DFT operations. (C) Flutter-analysis methodology for the leaflet displacement. The tracking curves on the leaflet indicate the horizontal and vertical locations along which the flutter behavior is quantified. High-resolution version of this figure is available in the SI Appendix.

