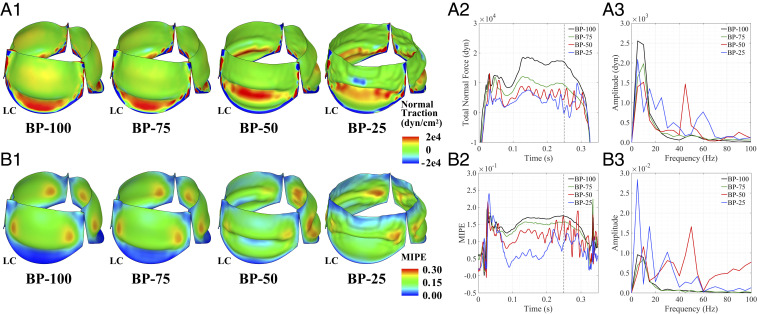
Fig. 6.
Frequency analysis of force and strain information on the leaflets. (A1) Leaflet normal traction at peak opening ( s). (A2) Integrated normal traction on the left coronary leaflet (LC). (A3) Frequency domain from the DFT operations for to 0.3 s of the integrated traction force. (B1) Leaflet maximum in-plane principal Green–Lagrange strain (MIPE) at peak opening ( s) evaluated on the aortic side of the leaflets. (B2) MIPE at the center of the free edge on the left coronary leaflet. (B3) Frequency domain from the DFT operations for to 0.3 s of the MIPE. High-resolution version of this figure is available in the SI Appendix.

