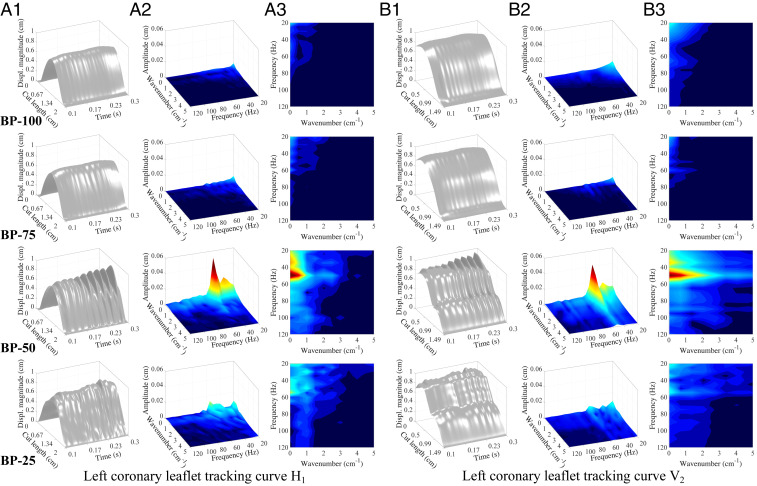
Fig. 7.
Frequency analysis of the leaflet displacement. Data are tracked on horizontal tracking curve (A1–A3) and vertical tracking curve (B1–B3) on the left coronary leaflet, as shown in Fig. 1C. A1 and B1 show the displacement magnitude visualization of the leaflet tracking curves throughout the - to 0.3-s portion of the valve-opening period. Cut length denotes the length of each tracking curve. A2–A3 and B2–B3 show the 3D view and 2D top view of the frequency domain visualization from the DFT operations for to 0.3 s of the displacement magnitude data, respectively. The data below 20 Hz are excluded for the computation of the flutter signal energy. High-resolution version of this figure is available in the SI Appendix.

