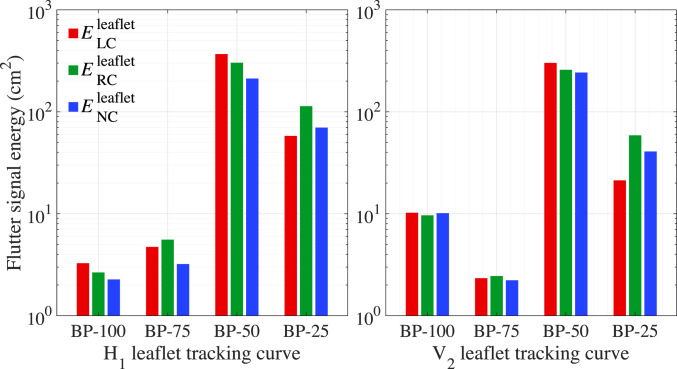
Fig. 8.
Quantified results of the flutter signal energy for tracking curves H1 (Left) and V2 (Right). indicates the signal energy on the left coronary leaflet for a single cardiac cycle. and indicate the signal energy on the right coronary and noncoronary leaflets, respectively. and indicate the free edge and the central vertical tracking curve on the leaflets, respectively, as shown in Fig. 1C.

