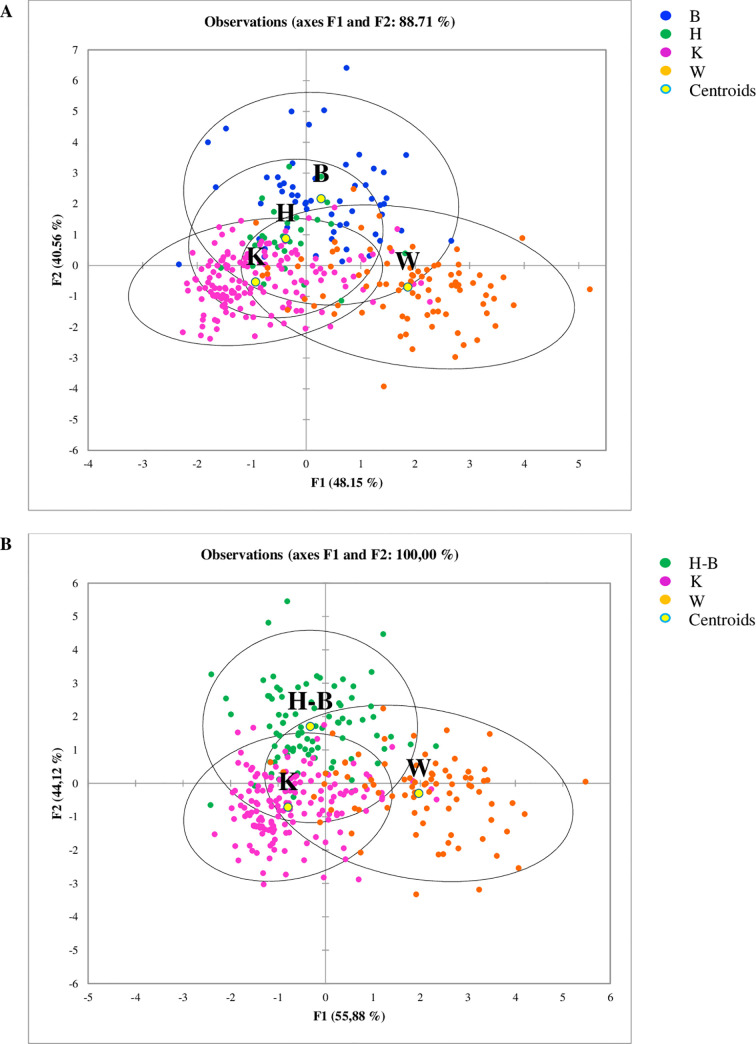
Fig 3. Linear Discriminant Analysis (LDA) based on relative abundances of bacteria genera, showing the clustering of the samples according to the diets.
(A) result of the LDA using four categories diets, showing that H and B diets are close to each other; (B) result of the LDA where H and B diets were collapsed in one group (H-B). W = Commercial moist complete diet; K = Commercial extruded complete diet; H = Home-made diet; B = Base diet; H-B = home-made diet and Base diet collapsed together.

