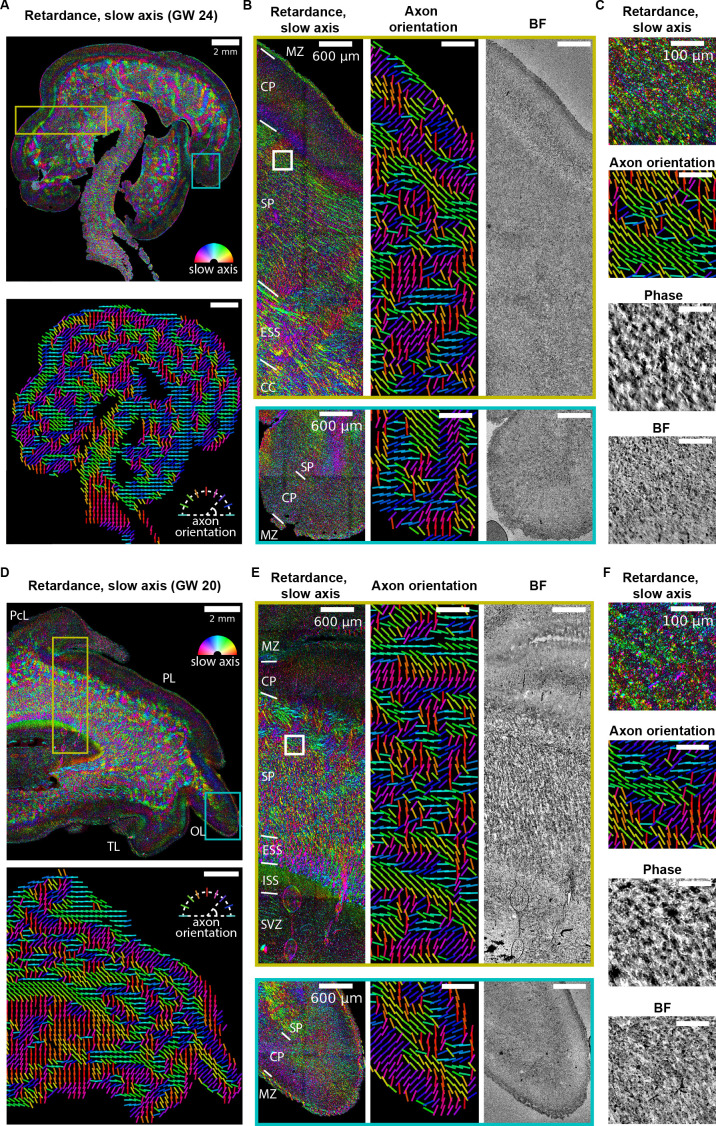
Figure 6. Label-free mapping of axon tracts in developing human brain tissue section.
(A) (top) Stitched image of retardance and slow axis orientation of a gestational week 24 (GW24) brain section from the test set. The slow axis orientation is encoded by color as shown by the legend. (Bottom) Axon orientation indicated by the lines. (B) Zoom-ins of retardace + slow axis, axon orientation, and brightfield at brain regions indicated by the yellow and cyan boxes in (A). (C) Zoom-ins of label-free images at brain regions indicated by the white box in (B) (D–F) Same as (A–C), but for GW20 sample. MZ: marginal zone; CP: cortical plate; SP: subplate; ESS: external sagittal stratum; ISS: internal sagittal stratum; CC: corpus callosum; SVZ: subventricular zone; PcL: paracentral lobule PL: parietal lobe; OL: occipital lobe; TL: temporal lobe. Anatomical regions in (B, D, and E) are identified by referencing to developing human brain atlas (Bayer and Altman, 2003).


