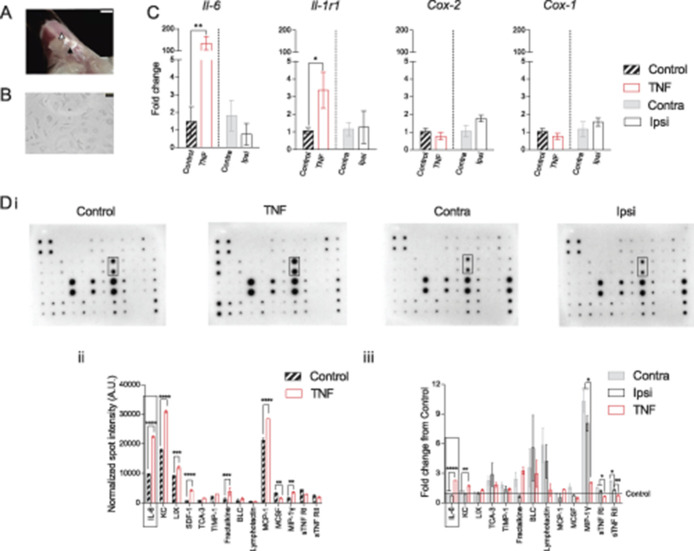
Figure 1.
Induction of inflammation in FLS derived from mouse knee. (A) Representative image showing exposed inside of the patella (black triangle) and the surrounding ligament and fat pad (white triangle) after midline resection and distal pull of the quadriceps muscles. Scale bar = 2 mm. (B) Representative image of FLS in culture. Scale bar = 50 µm. (C) Bars represent fold change of the genes Il-6, Il-1r1, Cox-2, and Cox-1 from either Contra (vs Ipsi) or control (vs TNF). Black hatched bars = control FLS, red bars = TNF-FLS, gray bar = Contra, white bar = Ipsi. All FLS at P5. (D) Images of mouse inflammatory array membranes probed against FLS conditioned medium (i), which were quantified by densitometry and represented as bar graphs showing fold change of various cytokines between control and TNF-FLS (ii, multiple t test with Holm–Sidak correction) and among Contra, Ipsi, and TNF from control FLS media (iii, ANOVA with Tukey post hoc test) and spot intensity differences. Rectangles highlight IL-6 spots (Di) and corresponding quantifications (Dii, iii). Only cytokines that were present in all the compared groups are shown in graphs. *P < 0.05, **P < 0.01, ***P < 0.001 and ****P < 0.0001. Error bars = SEM. ANOVA, analysis of variance; FLS, fibroblast-like synoviocytes.

