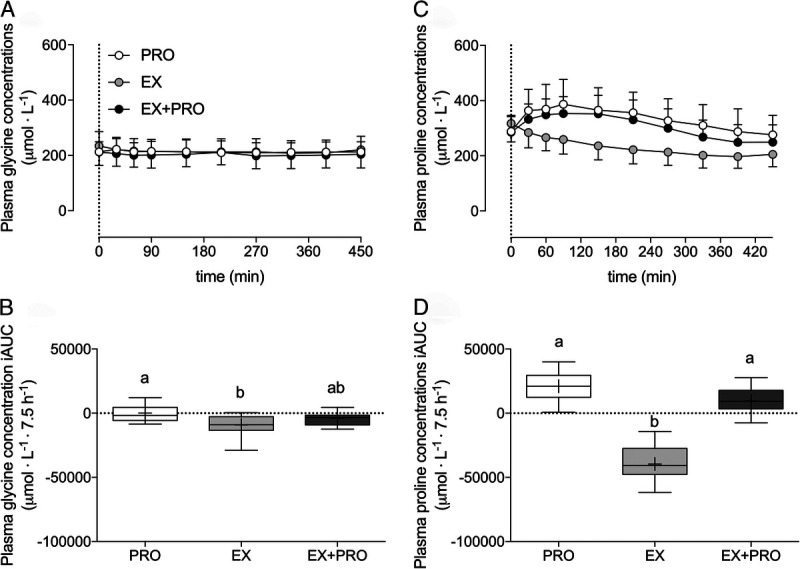
FIGURE 3.

Overnight plasma glycine concentrations (A), glycine iAUC (B), proline concentrations (C), and proline iAUC (D) (μmol·L−1). The dotted line represents the ingestion of the presleep protein. Plasma concentrations over time are expressed as mean ± SD. Plasma iAUC is expressed as box and whisker plots with the median (line), mean (cross), interquartile range (box), and minimum and maximum values (tails), and treatments without a common letter differ, P < 0.05. Plasma concentrations over time were analyzed with a two-way repeated-measures (within-subject factor: time; between-subject factor: treatment) ANOVA. Plasma concentration iAUC was analyzed with a one-way (between-subject factor: treatment) ANOVA. Glycine concentrations: time effect, P < 0.001; treatment effect, P = 0.761; time–treatment interaction, P = 0.006. Glycine iAUC: main treatment effect, P = 0.008; EX vs PRO post hoc comparison, P = 0.006. Proline concentrations: time effect, P < 0.001; treatment effect, P < 0.001; time–treatment effect, P = 0.002. Proline iAUC: main treatment effect, P < 0.001; EX vs PRO and EX vs EX + PRO post hoc comparisons, P < 0.001. iAUC, incremental area under the curve; PRO, presleep protein ingestion without prior exercise; EX, placebo ingestion with prior exercise; EX + PRO, protein ingestion with prior exercise.
