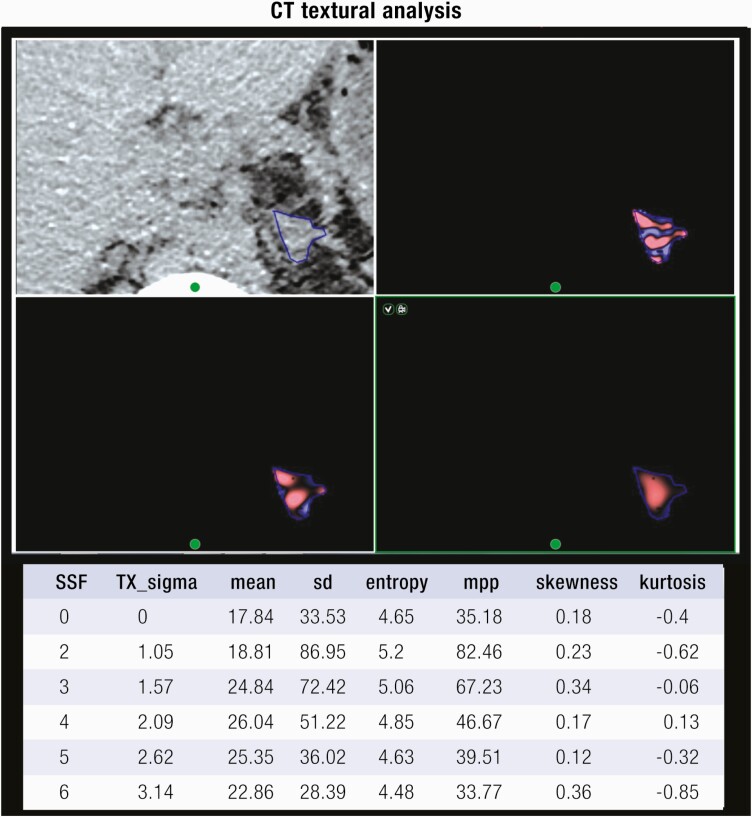
Figure 14.
CT textural analysis. Axial CT image showing left adrenal lesion segmentation (blue contours, top left) and adrenal lesion textural features displayed using fine (top right), medium (bottom left) and coarse (bottom right) filters using TexRADTM software. First-order textural parameters extracted from the lesion are tabulated below. SSF, spacial scaling factor; SD, standard deviation; MPP, mean of positive pixels.

