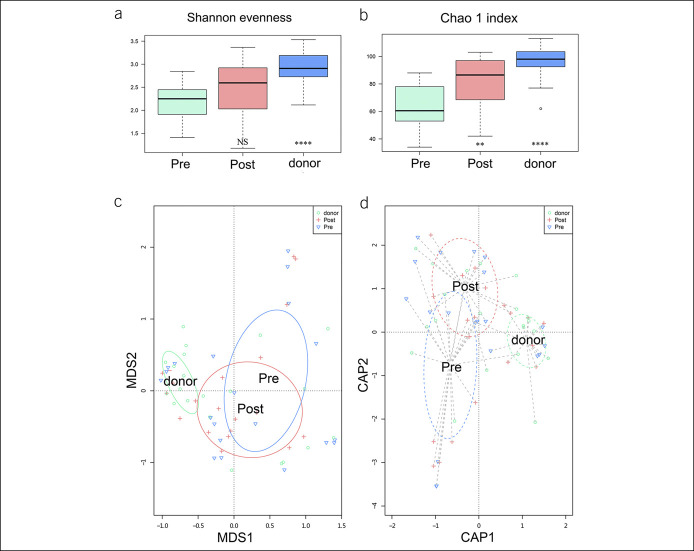
Figure 4.
The diversity of microbiota in donors and patients with UC before and after FMT. (a and b) Alpha diversity was calculated by Shannon evenness and Chao 1 index. The donors' and post-FMT patients' samples were compared with pre-FMT patients' samples. (c and d) Beta diversity was calculated by MDS and CAP coordinates. Each dot stands for 1 sample. P value less than 0.05 was considered statistically significant. Significance levels: *P < 0.05, **P < 0.01, ***P < 0.001, and ****P < 0.0001. The number of samples: donors (n = 19), patients with UC pre-FMT (n = 22), patients with UC post-FMT (n = 20). CAP, canonical analysis of principal; FMT, fecal microbiota transplantation; MDS, multidimensional scaling; UC, ulcerative colitis.

