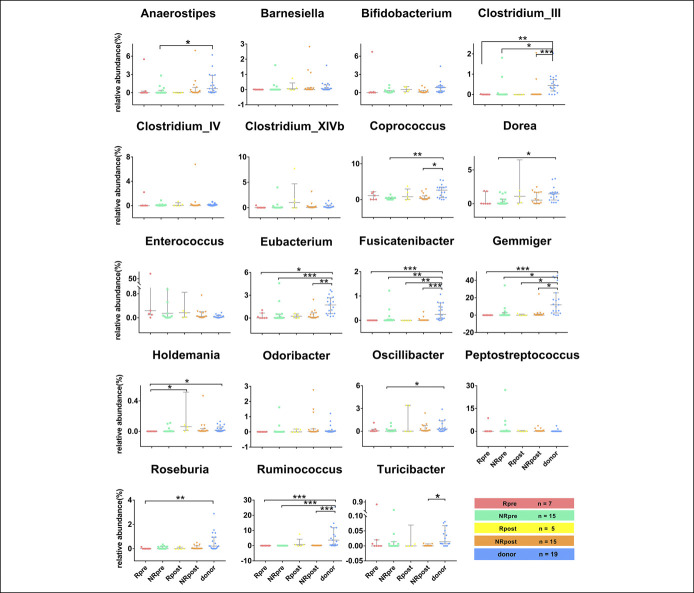
Figure 7.
Comparisons of the 19 genera relative abundance between UC patients with sustained remission and nonremission from FMT. NRpre, genera in the nonremission group before FMT; NRpost, genera in the nonremission group after FMT; Rpost, genera in the remission group after FMT; Rpre, relative abundance of genera in the remission group before FMT. P value less than 0.05 was considered statistically significant. Significance levels: *P < 0.05, **P < 0.01, ***P < 0.001, and ****P < 0.0001. The number of samples: donor (n = 19), Rpre (n = 7), NRpre (n = 15), Rpost (n = 5), and NRpost (n = 15).

