
Figure 10.
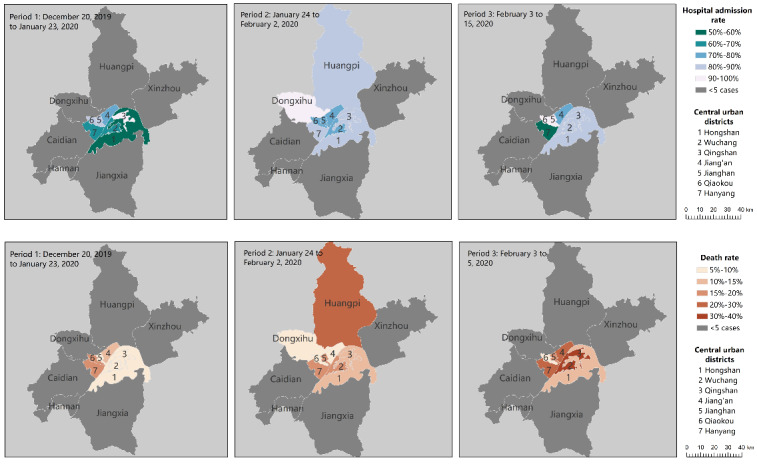
Geographic distributions of mortality and hospital admission rates of coronavirus cases across three time periods in Wuhan, China. The mortality and admission rate of the cases were calculated using the number of deaths or admissions divided by the total number of cases reported in the area and time period. The data include all 13 districts of the city of Wuhan; regions with fewer than 5 cases were considered to be nonrepresentative and are plotted in grey.