Figure 3.

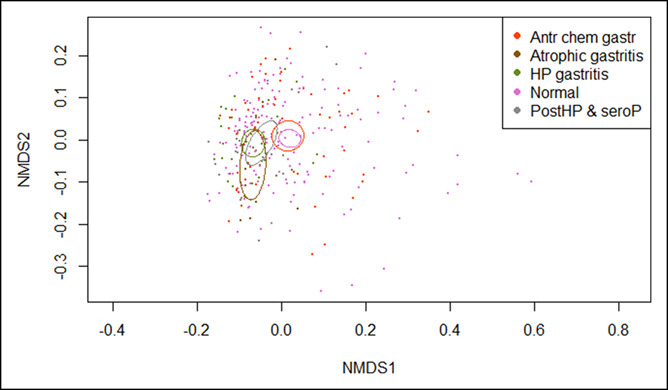
Plot of Bray–Curtis distances based on nonmetric multidimensional scaling (NMDS) (stress = 0.086). The ellipses represent 95% confidence intervals surrounding each group.

Plot of Bray–Curtis distances based on nonmetric multidimensional scaling (NMDS) (stress = 0.086). The ellipses represent 95% confidence intervals surrounding each group.