Figure 2.

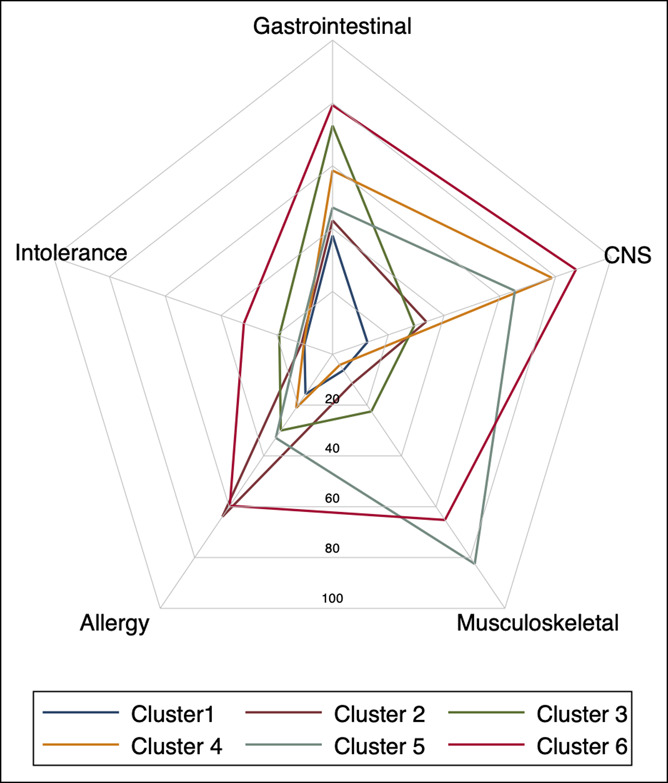
Radar plot of main symptom groups and self-diagnosed intolerances in the 6 long-term symptom clusters defined by latent class analysis. Data normalized to a 0–100 scale are shown. CNS, central nervous system.

Radar plot of main symptom groups and self-diagnosed intolerances in the 6 long-term symptom clusters defined by latent class analysis. Data normalized to a 0–100 scale are shown. CNS, central nervous system.