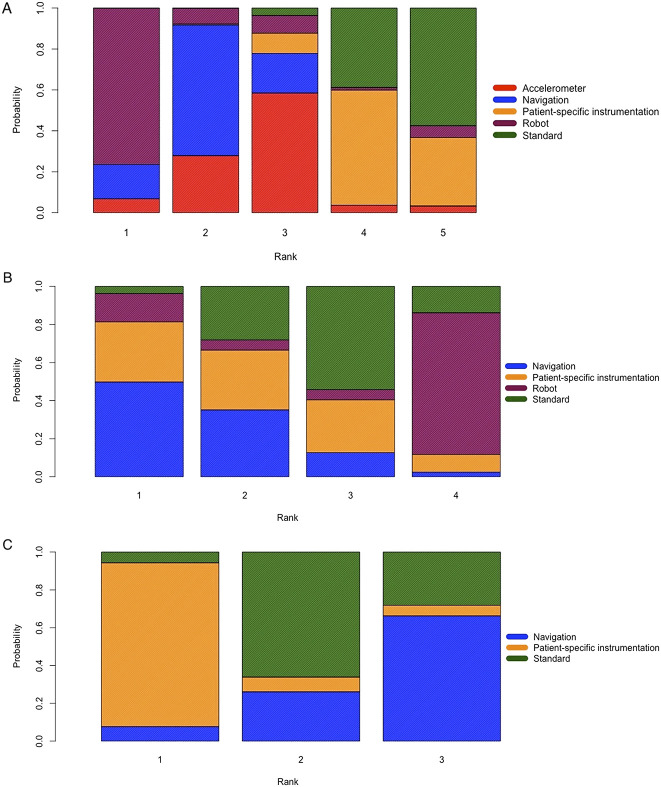
Fig. 5 A-C.
These images show rank probabilities of (A) the HKA malalignment angle, (B) delta KSS at the first 6 months postoperatively, and (C) delta WOMAC scores at the first 6 months postoperatively for each cutting guide. The x axis represents the ranking. The y axis represents the probability of rank: 0% to 100%. Each color represents one cutting guide: red for accelerometer-based navigation, blue for navigation, yellow for patient-specific instrumentation, purple for robot navigation, and green for the standard cutting guide; PSI = patient-specific instrumentation.

