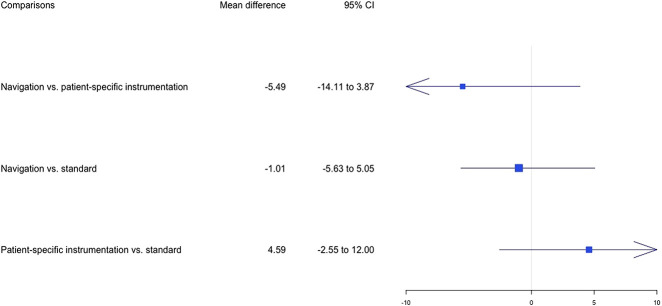
Fig. 7.
Forest plots in the network meta-analysis of the mean difference of WOMAC scores between preoperatively and 6 months postoperatively are shown The data are presented as the relative mean differences with 95% credibility intervals, which were obtained using random effects models. The I2 of the network meta-analysis was 1%.

