Table 1.
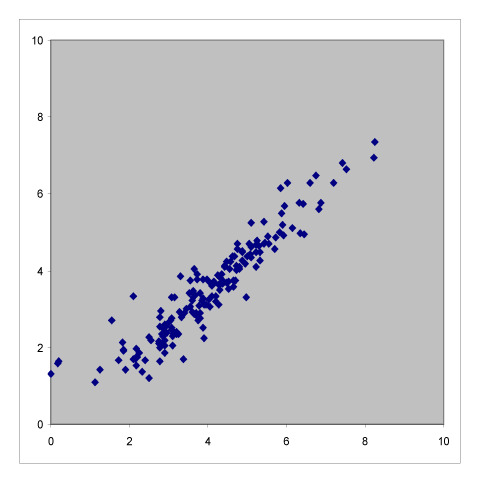
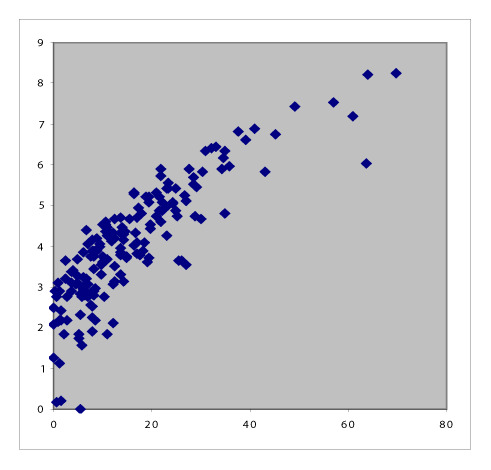
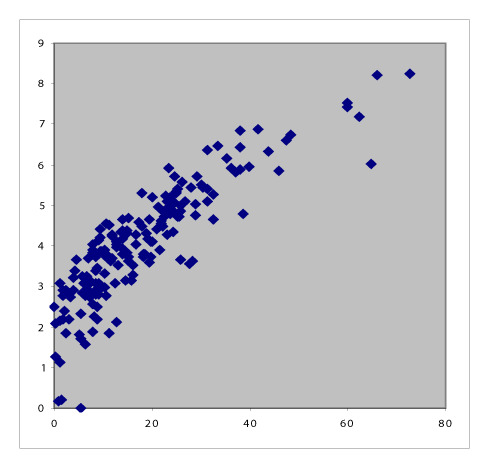
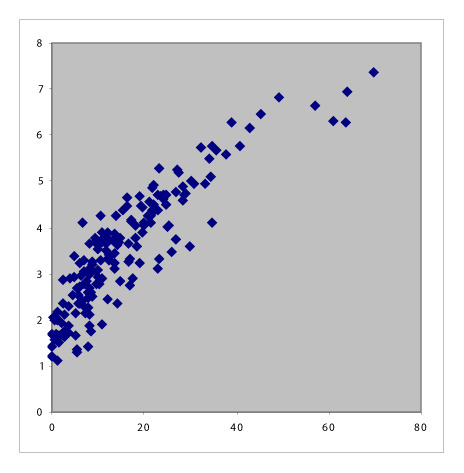
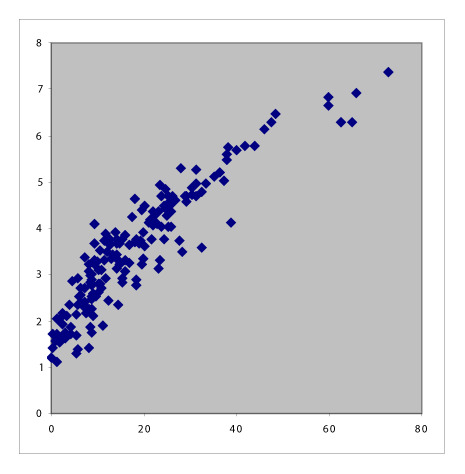
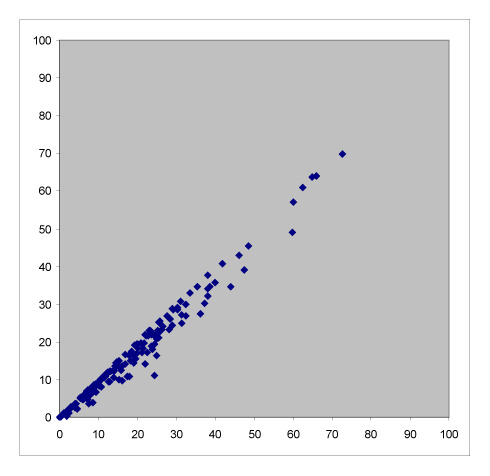
Scatter plots with correlation coefficients showing the relationship between the four RA activity indices.
| DAS28-ESR |
|
|
|
|
| |||
| Pearson’s correlation coefficient | DAS28-CRP |
|
|
| 0.942, p<0.001 | |||
| Spearman’s Rho | |||
| 0.952, p<0.001 | |||
| Kendall’s Tau-b | |||
| 0.818, p<0.001 | |||
|
| |||
| Pearson’s correlation coefficient | Pearson’s correlation coefficient | CDAI |
|
| 0.876, p<0.001 | 0.918, p<0.001 | ||
| Spearman’s Rho | Spearman’s Rho | ||
| 0.916, p<0.001 | 0.946, p<0.001 | ||
| Kendall’s Tau-b | Kendall’s Tau-b | ||
| 0.751, p<0.001 | 0.809, p<0.001 | ||
|
| |||
| Pearson’s correlation coefficient | Pearson’s correlation coefficient | Pearson’s correlation coefficient | SDAI |
| 0.896, p<0.001 | 0.941, p<0.001 | 0.988, p<0.001 | |
| Spearman’s Rho | Spearman’s Rho | Spearman’s Rho | |
| 0.933, p<0.001 | 0.965, p<0.001 | 0.986, p<0.001 | |
| Kendall’s Tau-b | Kendall’s Tau-b | Kendall’s Tau-b | |
| 0.782, p<0.001 | 0.851, p<0.001 | 0.914, p<0.001 | |
The statistics shown are Pearson’s correlation coefficient, Spearman’s Rho, and Kendall’s Tau-b.
CDAI: clinical disease activity index; CRP: C-reactive protein; DAS: disease activity score; ESR: erythrocyte sedimentation rate; SDAI: simple disease activity index.
