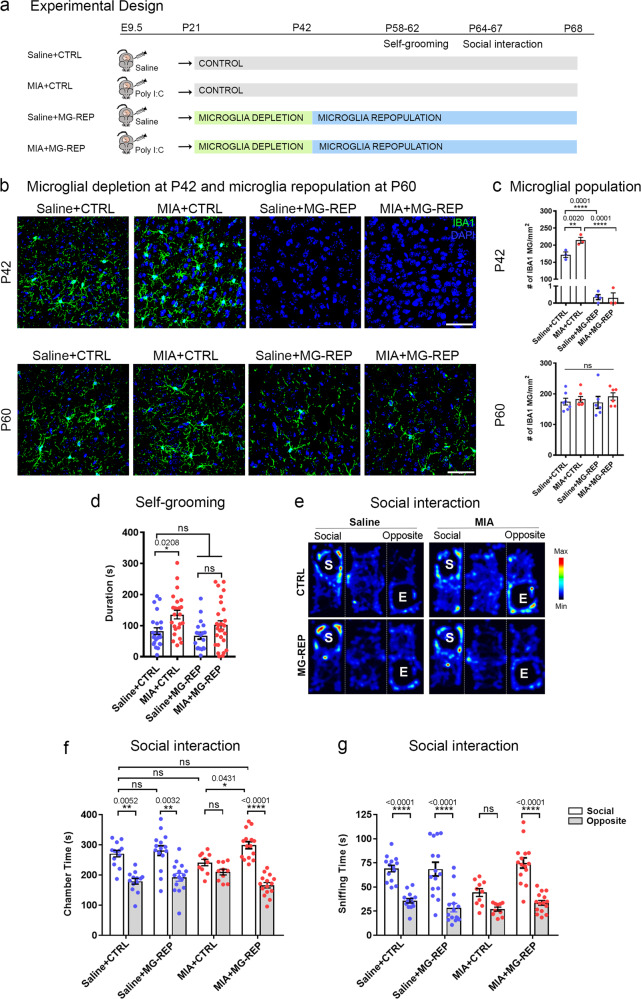
Fig. 1. Microglia depletion and repopulation corrects repetitive behavior and social deficits in MIA offspring.
a Timeline of drug treatment and behavioral testing. b Immunostaining of Saline + CTRL, MIA + CTRL, Saline + MG-REP and MIA + MG-REP animals at P42, after 3 weeks of PLX, and P60 after 18 days for repopulation, in the medial prefrontal cortex (mPFC), with antibodies against IBA1 (green) and DAPI (blue). Scale bar = 10 μm. c Quantification of IBA1+ cells in the mPFC showing complete microglial depletion by CSF1R inhibitor treatment and full recovery of microglia at P60. n = (3/2, 3/2, 4/2, 3/2) for male mice/litters per group P42 and n = (7/5, 7/5, 6/5, 6/3) male mice/litters per group for p60 (Saline + CTRL, MIA + CTRL, Saline + PLX and MIA + PLX). There was a main effect of prenatal treatment F(1,9) = 16.81, p = 0.0027 as well as main effect of drug treatment F(1,9) = 1486 p < 0.0001 and interaction effect F(1,9) = 16.31, p = 0.0029, at P42. d MIA male offspring show repetitive behavior deficits as shown in increased time spent grooming. Prenatal treatment effect, F(1,90) = 11.62, P = 0.0010, Drug effect, F(1,90) = 3.525, p = 0.0637, Interaction effect, F(1,90) = 0.5208, p = 0.4724, n = (23/9, 24/9, 19/11, 28/7) male mice/litters for (Saline + CTRL, MIA + CTRL, Saline + MG-REP, MIA + MG-REP). e–g Corrected social behavior in MIA male offspring by MG-REP: e Representative heatmaps of Three Chamber Social Interaction Test, “S”: tube containing social mouse, “E”: empty tube. f Difference in duration of time spent in “social” versus “opposite” chambers in saline offspring (left) and MIA offspring (right). Prenatal treatment effect, F(1,49) = 0.1947, P = 0.6610, Drug effect, F(1,49) = 5.289, p = 0.0258, chamber effect, F(1,49) = 57.20, p < 0.0001, Interaction effect, F(1,49) = 5.296, p = 0.0257. g Difference in duration of time spent sniffing the “social” versus empty “opposite” cylinders in saline offspring (left) and MIA offspring (right). Prenatal treatment effect, F(1,50) = 3.632, P = 0.0624, Drug effect, F(1,50) = 6.354, p = 0.0149, chamber effect, F(1,50) = 87.69, p < 0.0001, Interaction effect, F(1,50) = 1.544, p = 0.2198. n = (15/5, 15/9, 12/5, 15/4) male mice/litters for (Saline + CTRL, Saline + MG-REP, MIA + CTRL, MIA + MG-REP), *p < 0.05; **p < 0.01; ****p < 0.0001, ns denotes no significance; determined by 3-way ANOVA (alpha = 0.05) and Sidak post-hoc. Graphs indicate mean ± s.e.m.

