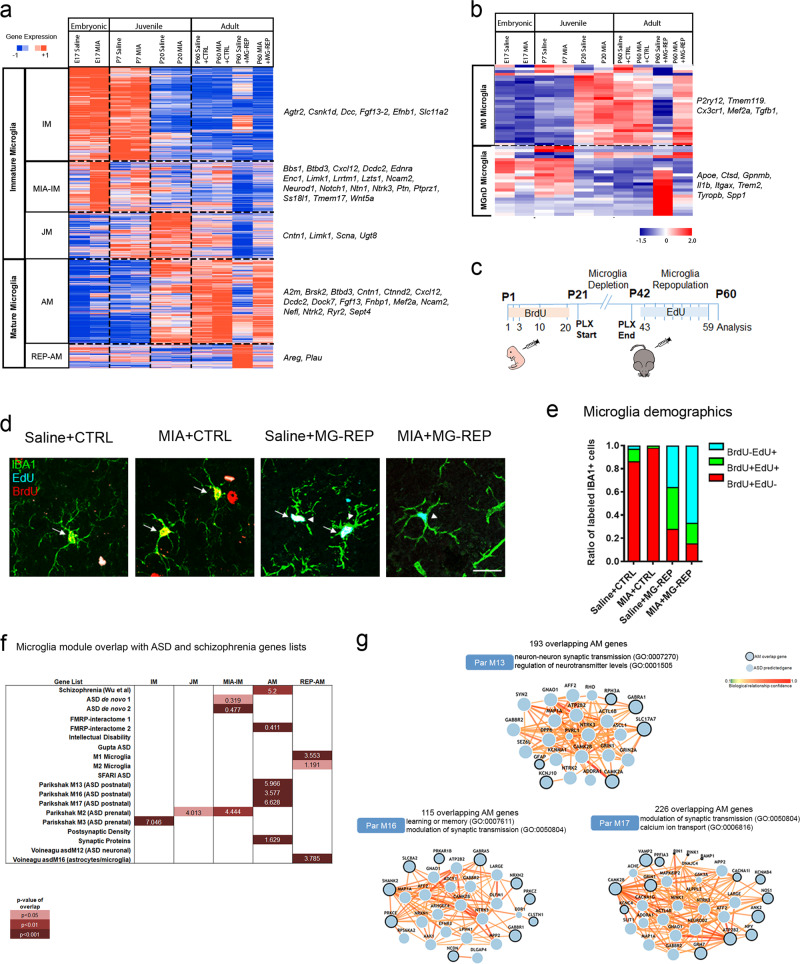
Fig. 2. Microglial transcriptome reveals novel MIA and repopulation modules and overlap of MIA microglial genes with ASD gene network.
a Heatmap (z-scores) of differentially expressed genes in acutely isolated microglia in five modules: immature microglia (IM), MIA immature microglia (MIA-IM), juvenile microglia (JM), adult microglia (AM), repopulated adult microglia (REP-AM). n = 3 microglia samples per group, one sample consists of one litter for E17, three pooled brains for P7, and one brain for P20 and P60 (male and female). b Heatmap (z-scores) of differentially expressed genes in acutely isolated microglia in M0 (homeostatic microglia) and DAM/MGnD-specific genes (E17-P60: male and female microglia). Fate mapping analysis of repopulating microglia. c Schematic diagram of BrdU and EdU injections from P1 to P59. BrdU and EdU were injected in a total of five (P1, 2, 3, 10, and 20) and eight times (every other day from P43-59), respectively. d Representative images of BrdU (red), EdU (cyan), and IBA1 (green) microglia for Saline + CTRL, MIA + CTRL, Saline + MG-REP and MIA + MG-REP. Arrow shows BrdU+IBA1+ original microglia. Arrowhead shows EdU+IBA1+ repopulated microglia. Scale Bar = 20 μm. e Demographics of all groups in cortex: BrdU+EdU− originally dividing microglia (red), BrdU+EdU+ repopulated originally dividing microglia (green), BrdU−EdU+ repopulated originally non-dividing microglia (blue). (19/4/2, 12/3/2, 18/4/2, 20/4/2) sections/female mice/litters for Saline + CTRL, MIA + CTRL, Saline + MG-REP and MIA + MG-REP. f Microglia module overlap analysis with human neurodevelopmental disorder-associated gene modules. Color scale denotes p value of hypergeometric distribution analyses. Numbers on table denote percent overlapped genes out of total number of genes in the modules with significant overlap (p < 0.05). g Network generation of overlapping human ASD modules (ParM13, M16, and M17) and AM microglia identify common genes underlying AM-associated molecular networks and highlight the contribution of microglia to the pathogenesis of human neurodevelopmental disorders. The overall connectedness of the gene list for each module was greater than all 100,000 permuted gene lists, yielding p < 0.00001.

