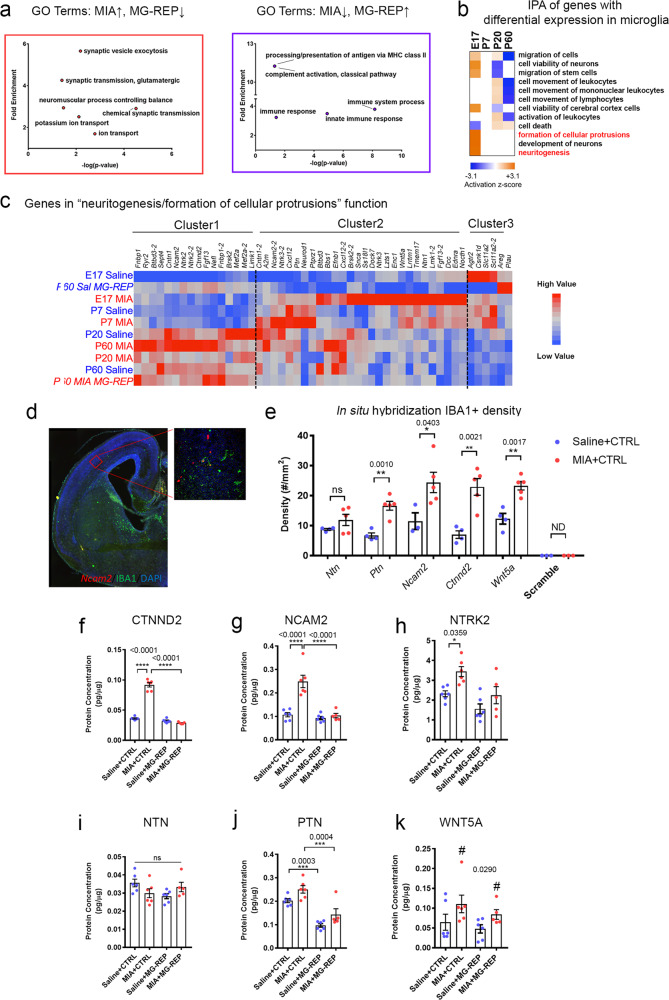
Fig. 3. Microglia repopulation attenuates exacerbated production of cellular protrusion/neuritogenic factors from MIA microglia.
a Gene ontology (GO) biological processes pathway analysis shows that MIA microglia increase synaptogenic functions while repopulated microglia recover homeostatic functions. Left (red): Top significantly enriched GO biological process terms increased by MIA and decreased by repopulation. Right (purple): Top significantly enriched GO biological process terms decreased by MIA and increased by repopulation. These GO findings were verified using GORILLA. b IPA of genes with differential expression in microglia between MIA versus Saline (RNA-seq data). Pathway analysis reveals MIA-induced upregulation of neuritogenic gene expression, specifically in developmental stages, based on activation z-score. Red denotes pathway activated in E17 MIA microglia. c Genes in “neuritogenesis/formation of cellular protrusions” function. Hierarchal clustering of gene sets based on relative expression values; red: high relative expression, blue: low relative expression. Cluster 1 represents genes increased in adult MIA microglia but reduced in MIA + MG-REP including Ctnnd2, Ncam2, and Ntrk2. Cluster 2 represents genes increased in immature MIA microglia including Ncam2, Ntn, Ptn and Wnt5a. Cluster3 represents genes decreased in immature MIA microglia including Plau. In situ hybridization (ISH) and immunofluorescence of E17 Saline or MIA offspring in the cortical plate region. d mRNA of cellular protrusion/ neuritogenic genes (Ctnnd2, Ncam2, Ntn, Ptn, and Wnt5a) were detected by florescent-labeled antisense cRNA probes (red) but not by scramble cRNA probe (not detected: N.D.), and the sections were immunostained for IBA1 (green) and DAPI (blue). e The number of IBA1 + cells expressing the cellular protrusion/neuritogenic genes were quantified in the cortical plate region. n = (4–5/2) male mice/ litters per molecule for Saline and MIA, n = 3 for scramble control probe. *p < 0.05, **p < 0.01, ns denotes no significance, by unpaired Student t test. Graphs indicate mean ± s.e.m. ELISA verification of selected RNA-seq molecules: CTNND2 (f), NCAM2 (g), NTRK2 (h), NTN (i), PTN (j) and WNT5A (k) in acutely isolated microglia. MIA increases protein expression of cellular protrusion/neuriotgenic molecules in microglia that were normalized via repopulation. n = (6/4, 6/3, 5/3, 6/3) female mice/litters for P60 Saline + CTRL, MIA + CTRL, Saline + MG-REP and MIA + MG-REP. CTNND2: Prenatal treatment effect, F(1,19) = 157.1, p < 0.0001, Drug effect, F(1,19) = 262.7, p < 0.0001, Interaction effect, F(1,19) = 201, p < 0.0001, NCAM2: Prenatal treatment effect, F(1,19) = 23.76, p = 0.0001, Drug effect, F(1,19) = 26.29, p < 0.0001, Interaction effect, F(1,19) = 17.63, p = 0.0005, NTRK2: Prenatal treatment effect, F(1,18) = 13.99, p = 0.0015, Drug effect, F(1,18) = 12.45, p = 0.0024, Interaction effect, F(1,18) = 0.06203, p = 0.8061, NTN: Prenatal treatment effect, F(1,19) = 0.01669, p = 0.8986, Drug effect, F(1,19) = 0.8, p = 0.3823, Interaction effect, F(1,19) = 6.121, p = 0.0230, PTN: Prenatal treatment effect, F(1,19) = 10.31, p = 0.0046, Drug effect, F(1,19) = 52.02, p < 0.0001, Interaction effect, F(1,19) = 0.002927 p = 0.9574, WNT5A: Prenatal treatment effect, F(1,19) = 5.581, p = 0.0290, Drug effect, F(1,19) = 1.550, p = 0.2282, Interaction effect, F(1,19) = 0.0834 p = 0.7799, *p < 0.05, **p < 0.01, ***p < 0.001 and ****p < 0.0001 as determined by 2-way ANOVA (alpha = 0.05) with Tukey’s post-hoc. #p < 0.05 for main effect of MIA. Graphs indicate mean ± s.e.m.

