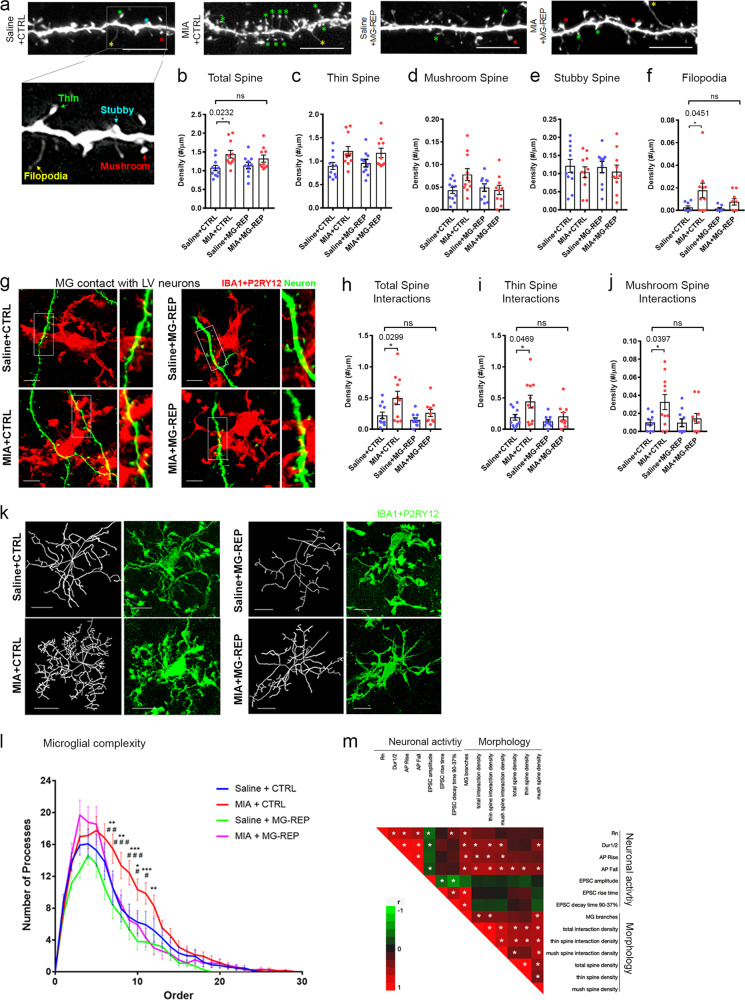
Fig. 5. CSF1R inhibitor treatment reverses increased basal dendritic spine density and enhanced microglia-neuron interactions in MIA offspring.
a Representative confocal images of biocytin-filled basal dendrites and spines of layer V pyramidal neurons of male mice. Scale bar = 7 μm. Asterisks mark each spine subtype: yellow = filopodia, red = mushroom, blue = stubby, green = thin. b-f MIA induces an increase in spine densities of layer V IB cells: MIA offspring display an increase in total, Prenatal treatment effect, F(1,38) = 9.7002, p = 0.035 Drug effect, F(1,38) = 0.08105, p = 0.7775, Interaction effect, F(1,38) = 1.67, p = 0.3082 (b) and filopodia Prenatal treatment effect, F(1,32) = 7.0552, p = 0.0122 Drug effect, F(1,32) = 2.07424, p = 0.1595, Interaction effect, F(1,32) = 1.276, p = 0.267 (e) spine densities, which is absent between Saline and MIA MG-REP groups. Thin (c), mushroom Prenatal treatment effect, F(1,38) = 2.3087, p = 0.1435, Drug effect, F(1,38) = 1.9774, p = 0.1678, Interaction effect, F(1,38) = 4.1241, p = 0.0493 (d) or stubby, Prenatal treatment effect, F(1,38) = 0.8267, p = 0.369 Drug effect, F(1,38) = 0.004168, p = 0.9489, Interaction effect, F(1,38) = 0.01588, p = 0.9007 (f) spine densities are unchanged. g Representative images of microglia (red) interacting with basal dendritic spines (green) of layer V pyramidal IB cells. Interaction was analyzed as described in Supplementary Figs. 5b–f. Scale bar = 4 μm. MIA offspring display an increase in microglia-spine interactions, which is absent between Saline and MIA MG-REP groups: Number of microglial interactions with total, Prenatal treatment effect, F(1,38) = 7.9465, p = 0.0076, Drug effect, F(1,38) = 5.09753, p = 0.0298, Interaction effect, F(1,38) = 1.4105, p = 0.2423 (h), thin Prenatal treatment effect, F(1,38) = 6.2423, p = 0.0169, Drug effect, F(1,38) = 5.089, p = 0.0299, Interaction effect, F(1,38) = 1.5544, p = 0.2201 (i) and mushroom spines Prenatal treatment effect, F(1,37) = 5.5939, p = 0.0234, Drug effect, F(1,37) = 2.5284, p = 0.1203, Interaction effect, F(1,37) = 2.3474, p = 0.1340 (j). b–f, h–j, Dendrites at least 95 µm distant from cell soma were evaluated. n = (11/8/5/3, 11/8/5/4, 10/8/5/3, 10/4/3/3), dendrites/cells/male mice/litters for (Saline + CTRL, MIA + CTRL, Saline + MG-REP, MIA + MG-REP). *p < 0.05, **p < 0.01, ***p < 0.001, and ****p < 0.0001, ns denotes no significance; determined by 2-way ANOVA (alpha = 0.05) and Tukey’s post-hoc. Graphs indicate mean ± s.e.m. k Representative P2RY12+IBA1+ microglia ×40 original magnification. Scale bar = 10 μm. l Microglial branch tracings shows that microglia repopulation normalizes MIA-induced hyper-ramification. Colors of trace points denote branch order. n = (25/6/4, 36/5/4, 24/6/4, 20/6/5) (cells/male mice/litters) for Saline + CTRL, MIA + CTRL, Saline + MG-REP, MIA + MG-REP. One, two, and three * or # symbols denote p < 0.05, 0.01, 0.001, between MIA + CTRL vs. Saline + CTRL or MIA + MG-REP by 2-way ANOVA and Tukey’s post-hoc, respectively. m Spearman’s correlation analysis of neuronal activities and morphological data from within-cell comparisons. Color map of rho values for positive and negative correlations from red (1) to green (−1). The properties of neuronal activities from IB cells include Rn, Dur1/2, AP rise, AP fall, sEPSC amplitude, sEPSC rise time, and sEPSC decay time. The properties of morphological assessments include MG branches (at 9th order), total spine interaction (with microglia) density (per dendritic length), thins spine interaction density, mush(room) spine interaction density, total spine density, thin spine density and mush(room) spine density. * denotes p < 0.05 as determined by Pearson’s correlation.

