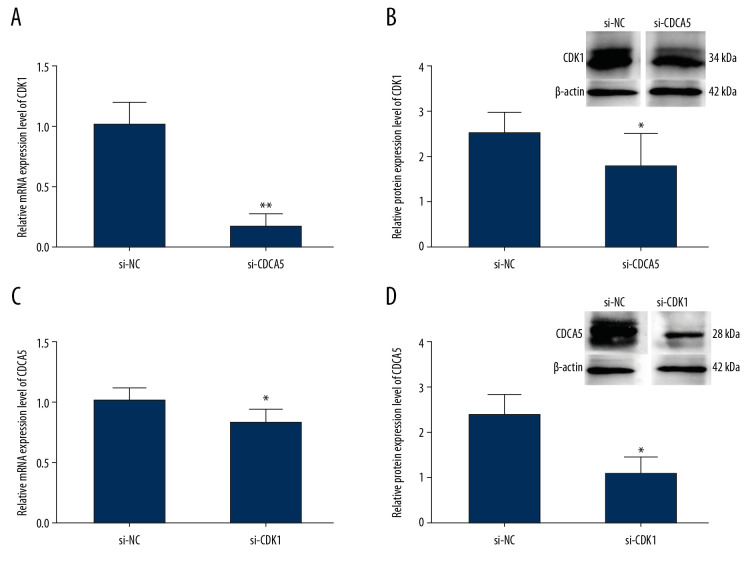
Figure 5.
Relationship between CDK1 expression and CDCA5 expression. To explore the relationship between CDK1 and CDCA5, cells were knocked down one gene and checked the mRNA and protein expression level changes of the other gene. (A) Relative mRNA expression levels of CDK1 in cells transfected with si-NC and si-CDCA5 by quantitative real-time polymerase chain reaction (RT-qPCR) (** P<0.01). (B) Relative protein expression levels of CDK1 in cells transfected with si-NC and si-CDCA5 by western blot (* P<0.05). (C) Relative mRNA expression levels of CDCA5 in cells transfected with si-NC and si-CDK1 by RT-qPCR (* P<0.05). (D) Relative protein expression levels of CDCA5 in cells transfected with si-NC and si-CDK1 by western blot (* P<0.05).

