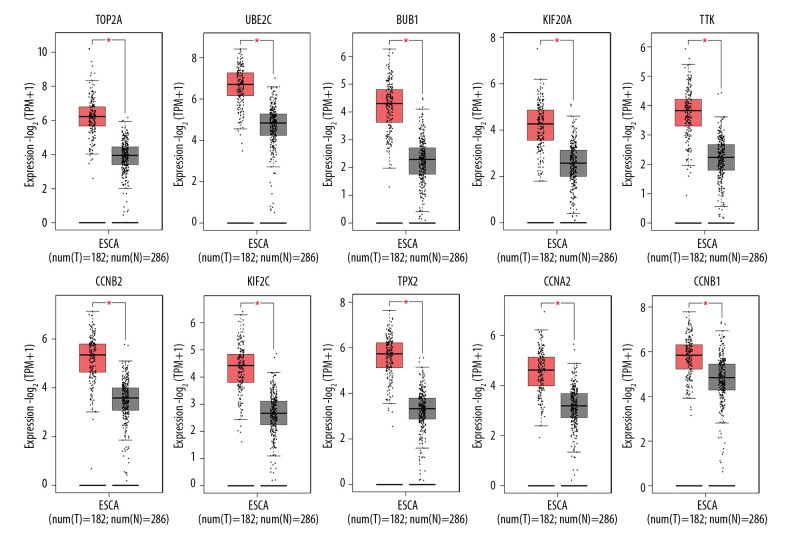
Figure 9.
Differences in expression level of the top 10 hub genes between ESCA tissue and matched normal tissue. The plots are based on TCGA and GTEx data, and reveal that these hub genes are significantly upregulated in ESCA tissue compared with normal tissue (p<0.01). The red * denotes statistically significant difference.

