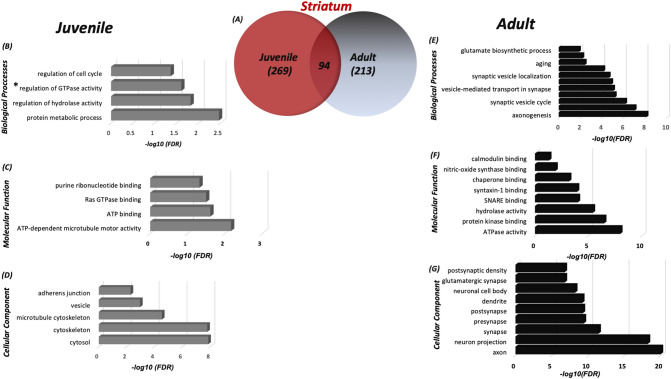
Figure 2.
Differences in the S-nitroso-proteome between the striatum of adult and juvenile mice according to the systems biology analysis. (a) Venn Diagram representing the SNO-proteins that were identified in the juvenile striatum and adult striatum. BP (b), MF (c) and CC (d) analysis was conducted on the SNO proteins exclusive to the juvenile cortex. BP (e), MF (f), and CC (g) analysis was conducted on the SNO proteins exclusive to the adult striatum. *Regulation of GTPase activity—positive regulation of GTPase activity. MetaCore from Clarivate Analytics (MetaCore version 6.34 build 69200) was used to generate this figure.

