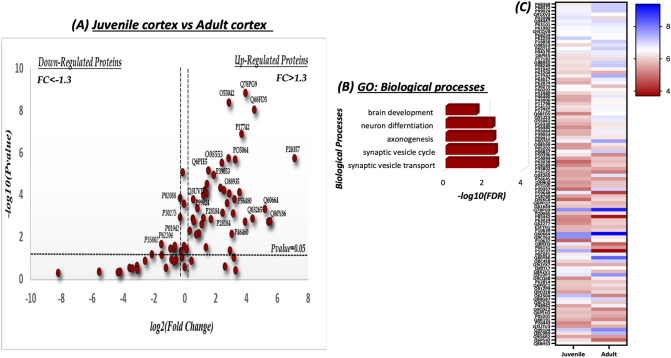
Figure 4.
Quantitative analysis of the shared SNO-proteins in the juvenile (J) and adult (A) cortex. (a) Volcano Plot analysis was conducted on the shared SNO proteins in the J cortex vs. A cortex. The fold change (FC) was calculated as the difference of the relative abundance between A and J divided to J [FC = ] and normalized using log2. The horizontal line represents a significance level of P value= 0.05. The vertical lines represent the threshold of the FC = 1.3. The upregulated proteins are those that appear on the right side of the plot. These proteins meet the statistical significance criteria of both P < 0.05 and a FC > 1.3. (b) Biological processes of the significant up-regulated SNO-proteins. (c) Heat map analysis representing the differential relative abundance of the shared SNO-proteins in the J and A cortex. The abundance scale was normalized by – log10. Prism-GraphPad 8 was used to generate this figure.

