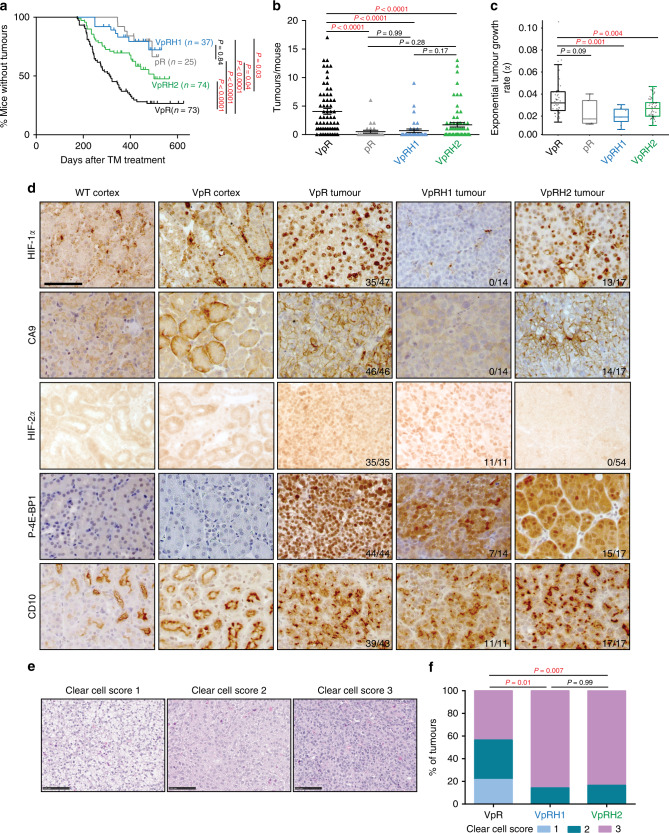
Fig. 1. ccRCC formation is strongly dependent on Hif1a and only moderately affected by Hif2a deletion.
a Tumour onset in cohorts of pR, VpR, VpRH1, and VpRH2 mice. P values were calculated by two-sided log-rank Mantel–Cox test. b Number of tumours per mouse at the time of sacrifice based on μ-CT imaging (VpR n = 65, pR n = 25, VpRH1 n = 36 and VpRH2 n = 65 mice). Mean ± SEM are shown, P values were calculated by Dunn’s multiple comparisons test. c Tumour growth rates based on μ-CT imaging (VpR n = 48, pR n = 5, VpRH1 n = 7 and VpRH2 n = 56 tumours). Box–whisker plots depict median, bounded by Q1 (25% lower quartile) and Q3 (75% upper quartile) and whiskers depict 1.5 times the Q3-Q1 interquartile range. P values were calculated by two-sided Student’s t test without adjustment for multiple comparisons. d Representative immunohistochemical stainings for the indicated antibodies in samples from WT cortex, a non-tumour region of VpR cortex, VpR, VpRH1, and VpRH2 tumours. All panels are the same magnification, scale bar = 50 μm. The number of positive tumours/number of tumours examined are indicated. e Representative examples of the histological appearance of tumours assigned clear cell scores of 1, 2, or 3. Scale bars = 100 μm. f Distribution of clear cell scores between VpR (n = 10 mice, 23 tumours), VpRH1 (n = 8 mice, 14 tumours) and VpRH2 (n = 9 mice, 18 tumours) tumour cohorts. P values were calculated using the two-sided Mann–Whitney U test without adjustments for multiple comparisons.

