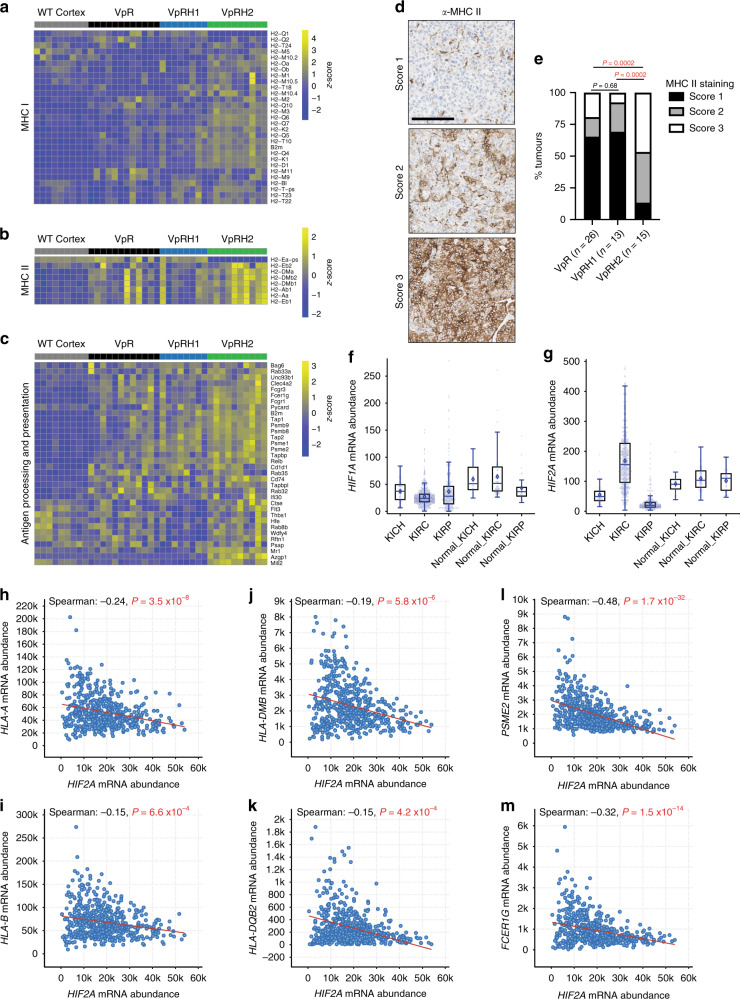
Fig. 5. HIF-2α influences the expression of MHC class I and II genes.
Gene expression heatmaps for MHC class I (a), class II (b), and other antigen processing and presenting (c) genes. Rows represent row-normalised z-scores of mRNA abundance, each column represents an individual sample from WT cortex or VpR, VpRH1, and VpRH2 tumours. Source data is provided in Supplementary Data 1 and 2. d Examples of different scores for MHC class II immunohistochemical staining. All panels are the same magnification, scale bar = 100 μm. e Distribution of MHC class II staining scores in the indicated (n) number of VpR, VpRH1, and VpRH2 tumours. P values are derived from the two-sided Mann–Whitney U test without adjustments for multiple comparisons. f, g Relative HIF1A and HIF2A mRNA abundance in TCGA datasets of human chromophobe (KICH, n = 66), clear cell (KIRC, n = 533), and papillary (KIRP, n = 290) renal cell carcinomas and associated normal renal tissues (Normal_KICH n = 25, Normal_KIRC n = 72, Normal_KIRP n = 32). Box–whisker plots depict median, bounded by Q1 (25% lower quartile) and Q3 (75% upper quartile) and whiskers depict 1.5 times the Q3–Q1 interquartile range. Spearman’s correlation analyses between HIF2A mRNA abundance and mRNA abundance of two MHC class I (h, i), class II (j, k), and antigen processing/presentation (l, m) genes in ccRCC (TCGA KIRC dataset). Source data is provided in Supplementary Data 4.

