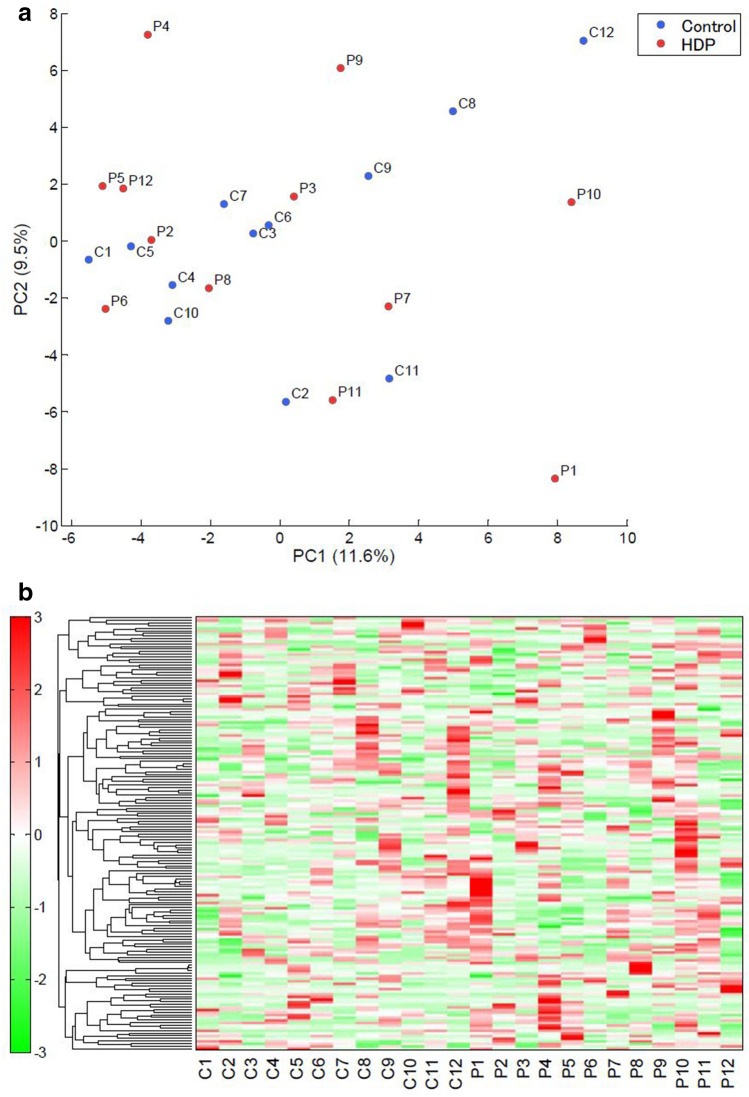
Figure 2.
First trimester maternal serum metabolomic profiles of Eo-HDP-affected and healthy pregnancies. (a) PCA. Plots show the PCA scores obtained from maternal serum samples. Metabolically similar samples are located close to one other in the score plot. The x-axis indicates the main PC and the y-axis indicates the secondary PC. Each PC represents an axis in multidimensional space and corresponds to the direction of maximum variation in the original data. Numbers in parentheses indicate the contribution rates of each PC. (b): HCA. Rows and columns indicate metabolites and cases, respectively. Relative metabolite levels are represented in different colours, with red and green indicating increased and decreased levels, respectively.

