Figure 1.
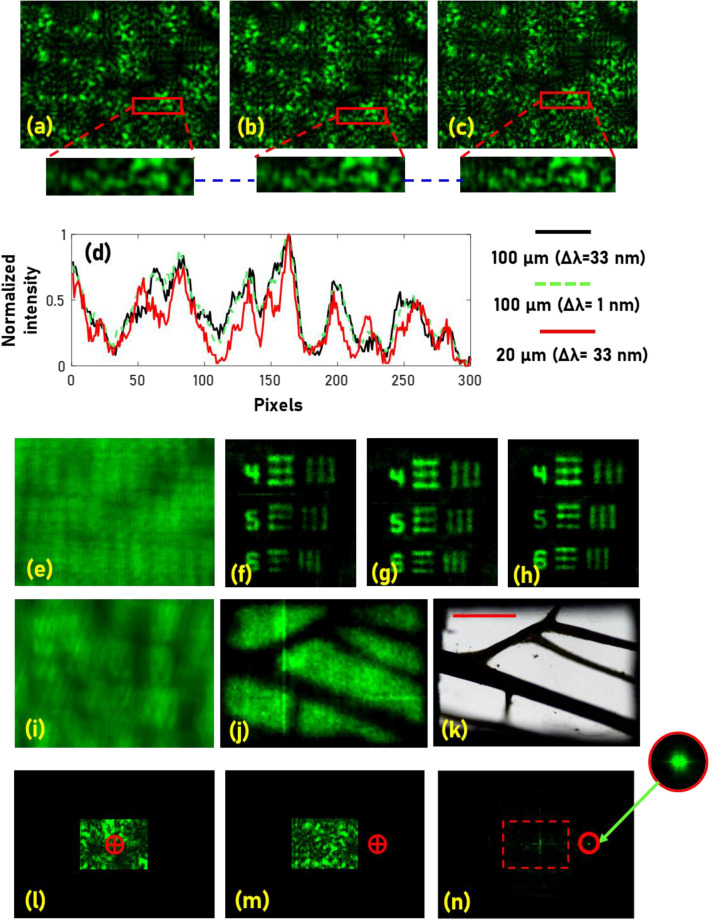
Two-dimensional imaging results. IPSFs for pinholes and spectrum (a) 100 μm (Δλ = 33 nm), (b) 100 μm (Δλ = 1 nm), (c) 20 μm (Δλ = 33 nm). (d) Identical signatures in (a–c) in a line is plotted in black, dotted green and red lines respectively. (e) IO recorded for the USAF object with spectral filter. The results of non-linear correlation (α = 0, β = 0.6) (f) between (e) and (a), (g) between (e) and (b) and, (h) between (e) and (c). (i) IO recorded for an area of insect wing and (j) reconstruction result. (k) The image of a wing from a regular microscope with ×5 magnification. (l) IPSF recorded only by the central area (1/3rd) of the image sensor, (m) random intensity distribution recorded after the pinhole is shifted in the object plane to move the direct image beyond the field of view limit of direct imaging. (n) Reconstruction result of the non-linear correlation between (i) and (j). The red dotted lines in (n) indicates the boundary of the field of view. The red marker in (l) and (m) indicates the location of the direct image. The blue dotted line indicates the line data region used for comparison in (d).

