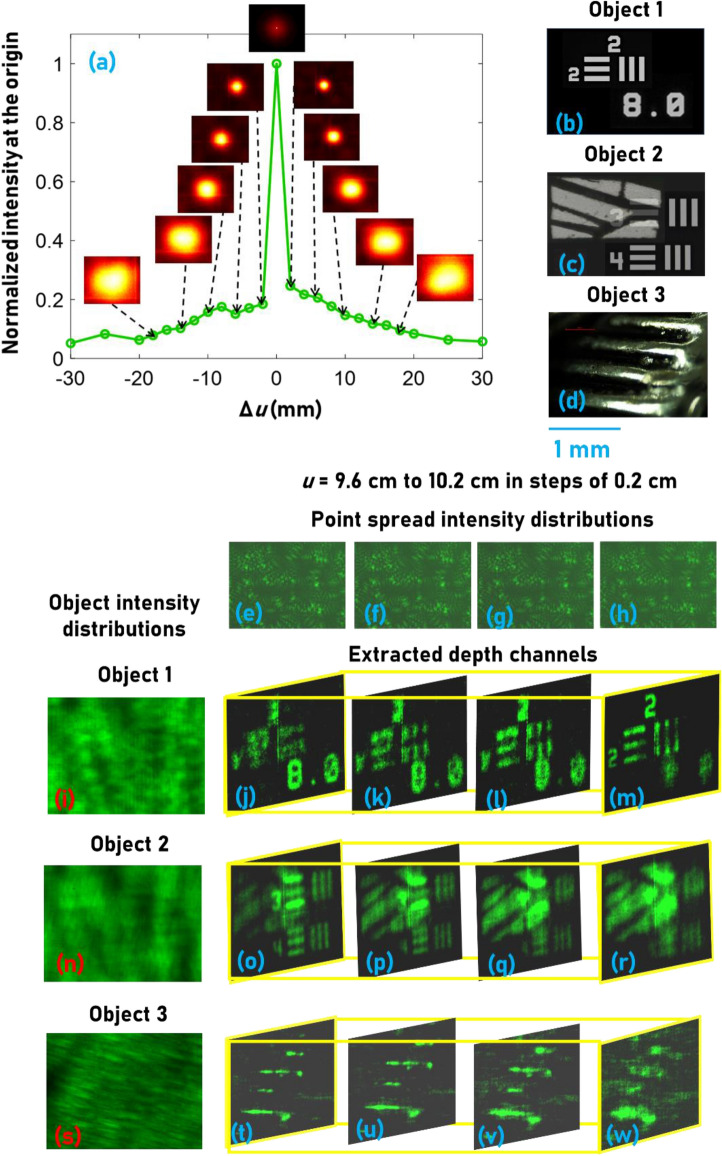
Figure 2.
Three-dimensional spatial imaging results. (a) Plot of cross-correlation intensity values at the origin with the variation in the axial location of the pinhole. Thick objects composed of (b) NBS (8 lp/mm) and USAF (Group 2, Element 2) resolution targets, (c) USAF resolution target (Group 2, Elements 3 and 4) and wing of an insect, (d) reflective metal strip. Images of the IPSFs recorded for (e) u = 9.6 cm, (f) u = 9.8 cm, (g) u = 10 cm, and (h) u = 10.2 cm. (i) IO for the thick object (b) with a thickness of 6 mm. (j–m) Depth channels extracted from (i) using the IPSF library (e–h) respectively. (n) IO recorded for the thick object (c) with a thickness of 4 mm. (o–r) Depth channels extracted from (n) using the IPSF library (e–h) respectively. (s) IO recorded for the thick object (d) with a thickness of 1 mm. (t–w) Depth channels extracted from (s) using the IPSF library (e–h), respectively.

