Figure 5.
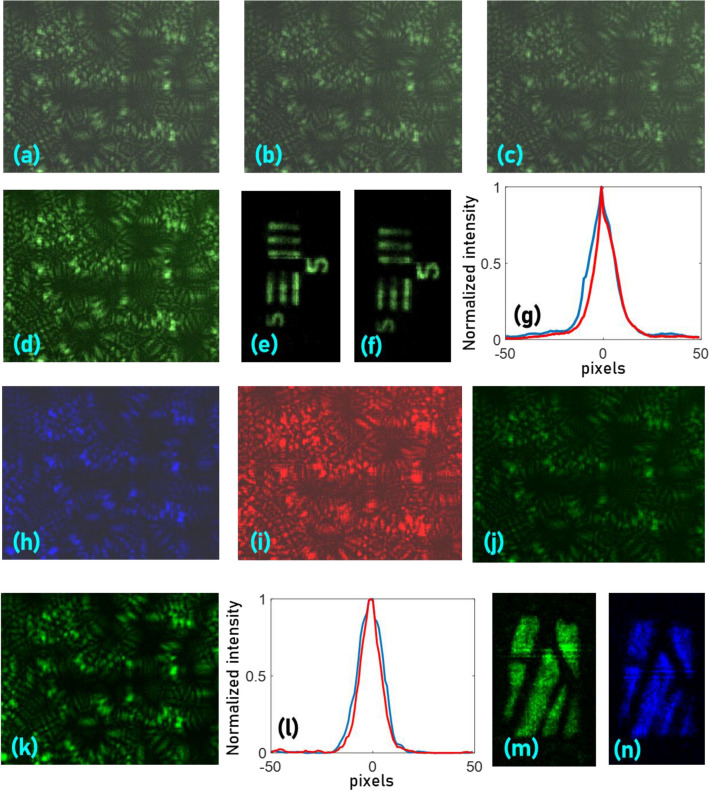
Reconstruction results using synthetic point spread functions. Images of the IPSFs recorded at axial locations (a) Δu = − 5 mm, (b) Δu = 0 and (c) Δu = 5 mm, for λ = 530 nm. (d) Image of the IPSF for Δu = 0, synthesized from Δu = − 5 mm with a magnification factor of 0.9875. Reconstruction results of a USAF object using (e) experimentally recorded and (f) synthesized point spread function. (g) Plots of the cross-correlation functions of the measured IPSF at Δu = 0 (Red) and the calculated scaled intensity distribution at Δu = -5 mm (Blue) with the measured IPSF at Δu = 5 mm. Images of the IPSFs recorded at Δu = 0, for (h) λ = 488 nm, (i) λ = 617 nm and (j) λ = 530 nm. (k) Image of the IPSF for λ = 530 nm, synthesized from λ = 488 with a magnification factor of 0.986. (l) Plots of the cross-correlation functions of the measured point spread intensity distribution for λ = 530 nm (Red) and the synthesized scaled intensity distribution for λ = 488 nm (Blue) with the measured IPSF for λ = 617 nm. Reconstruction results of wings of an insect using (m) experimentally recorded and (n) synthesized IPSFs.

