Figure 3.
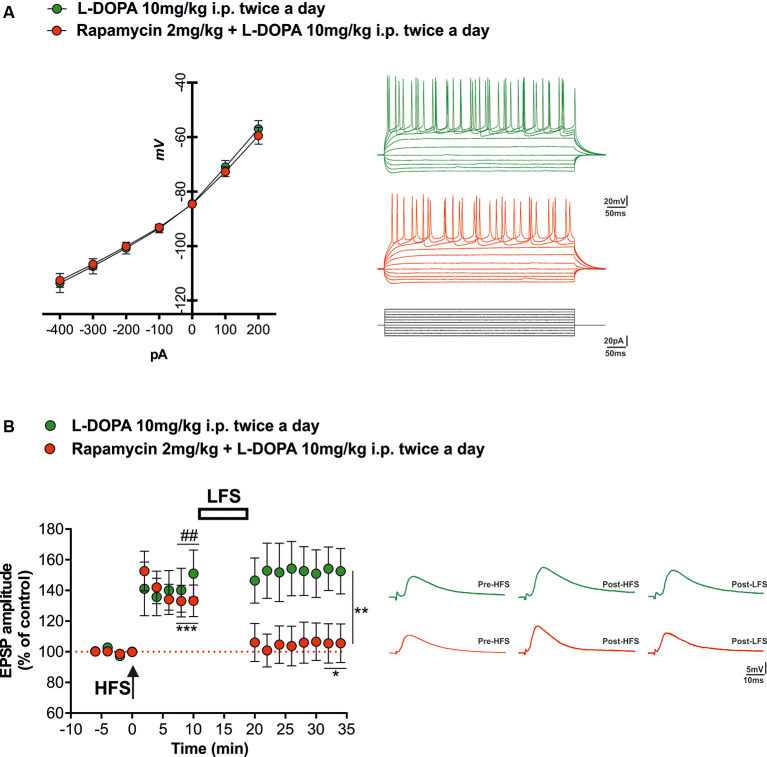
Synaptic plasticity in spiny projection neurons (SPNs) of L-DOPA vs. rapamycin + L-DOPA-treated rats. (A, left panel) Current-voltage curves obtained during current-clamp recordings of SPNs for each experimental group. (A, right panel) Tonic firings of SPNs obtained through intracellular and whole-cell patch clamp recordings of corticostriatal slices from animals treated with L-DOPA (green line) and with a combination of rapamycin plus L-DOPA (red line), in response to hyperpolarizing and depolarizing current pulses. (B, left panel) Time course of the high-frequency stimulation (HFS)-induced long-term potentiation (LTP) and low-frequency stimulation (LFS)-induced depotentiation in corticostriatal SPNs. (B, right panel) Representative corticostriatal excitatory postsynaptic potential (EPSP) amplitude traces showing the recovery of the LTP in each experimental group (L-DOPA and rapamycin + L-DOPA). The application of a HFS protocol induced LTP in both groups (L-DOPA ##p < 0.01; rapamycin + L-DOPA ***p < 0.001). LFS induced depotentiation only in the group treated with both rapamycin and L-DOPA (*p < 0.05 compared to 8-10 min post HFS; **p < 0.01 compared to L-DOPA alone group).

