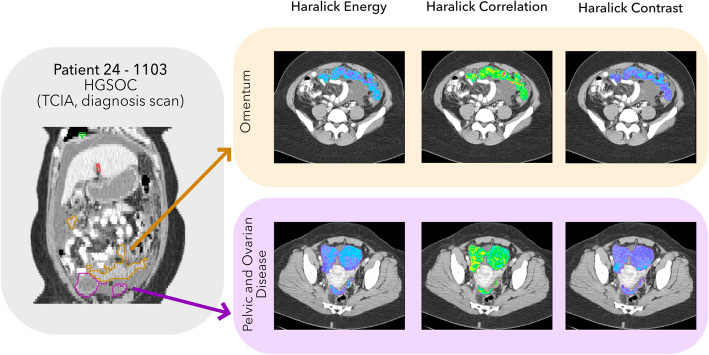
Fig. 3.
Example of texture analysis performed in a localised manner for omental and pelvic and ovarian disease (including the ovarian masses and peritoneal disease in the pouch of Douglas) of high-grade serous ovarian cancer (HGSOC) patient 24–1103 of The Cancer Imaging Archive (TCIA) repository to visualise the presence of distinct radiomic phenotypes in the same lesion. Texture maps were extracted using the Computational Environment for Radiotherapy Research (CERR) visualisation tool [71]. Haralick Energy, correlation and contrast look at different parameters of the Grey Level Co-occurrence Matrix (GLCM) used for texture analysis [72]. The brighter colours in the colourmaps refer to higher values of the parameters

