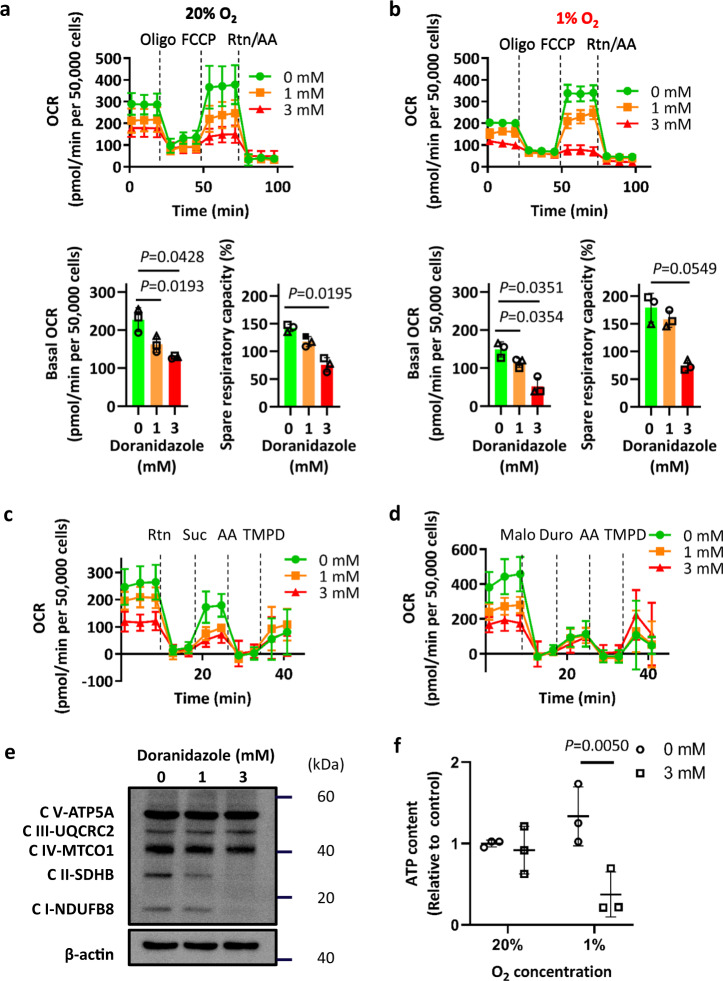
Fig. 4. Effect of doranidazole on mitochondrial function.
Extracellular flux analysis of GSC-H cells treated for 12 h with the indicated concentrations of doranidazole under normoxic (a) or hypoxic (b) conditions. Representative examples of changes in OCR after sequential injection of the indicated inhibitors (Oligo oligomycin, Rtn rotenone, AA antimycin A) as well as quantitative data for basal OCR and spare respiratory capacity (means ± s.d. for n = 3 independent experiments) are shown. Mitochondrial complex I-, complex II-, and complex IV-dependent OCR (c) and complex II-, complex III-, and complex IV-dependent OCR (d) measured in GSC-H cells after exposure to the indicated concentrations of doranidazole for 12 h and permeabilization of the plasma membrane. Suc succinate, Malo malonate, Duro duroquinol. Data are means ± s.d. for at least five biologically distinct replicates in n = 1 experiment. e Immunoblot analysis of mitochondrial complex (C) proteins in GSC-H cells treated for 24 h with the indicated concentrations of doranidazole. f ATP content of GSC-H cells exposed to doranidazole under normoxic or hypoxic conditions for 12 h. Data are expressed relative to the value for normoxia and 0 mM doranidazole and are means ± s.d. from n = 3 three independent experiments. Statistical analysis was performed by one-way ANOVA followed by Dunnett’s post hoc test a, b, or with the two-way ANOVA followed by Sidak’s post hoc test f.

