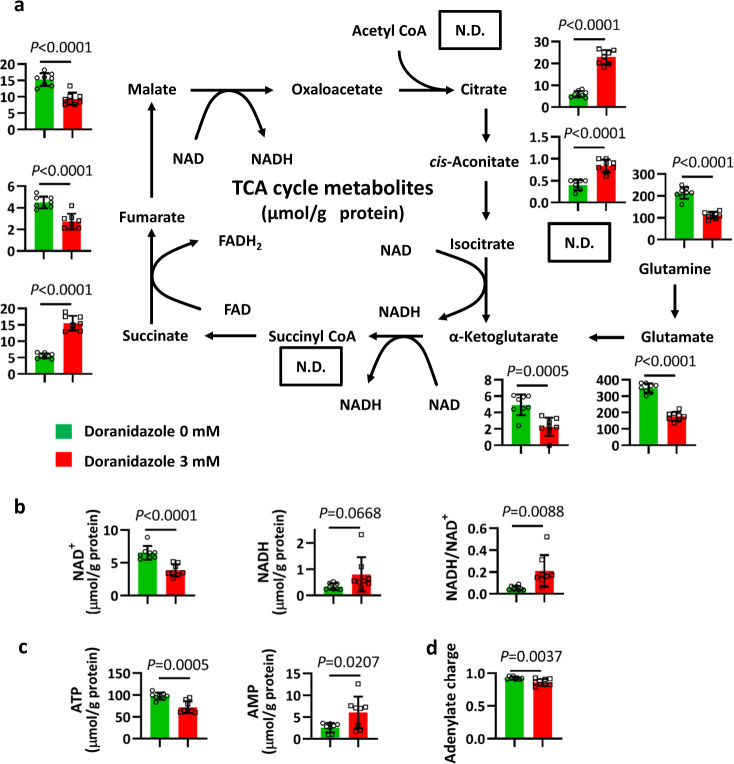
Fig. 5. Effects of doranidazole on intracellular metabolite levels in GSC-H cells.
a Metabolome analysis for the TCA cycle in GSC-H cells exposed to 0 or 3 mM doranidazole for 24 h. N.D. not detected. The amounts of NAD+ and NADH and the NADH/NAD+ ratio (b) as well as ATP and AMP (c) and the total adenylate charge (d) were also determined. Metabolite levels were normalized by total protein amount, are means ± s.d. from eight biologically distinct replicates, n = 1 experiment, and were analyzed by the unpaired two-tailed Student’s t-test.

