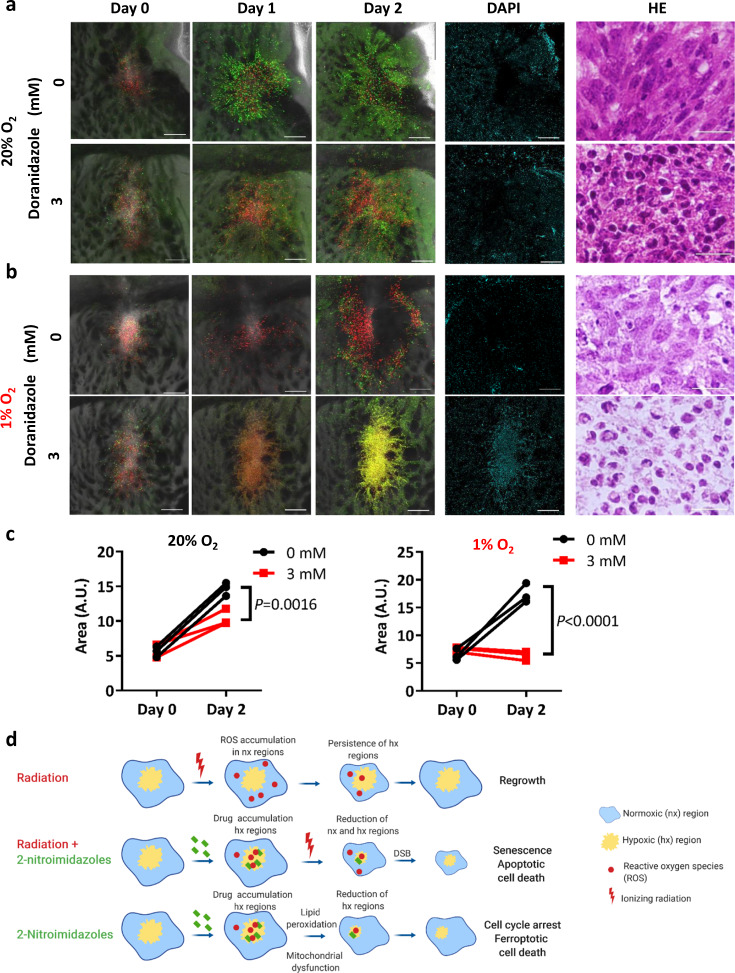
Fig. 6. Effects of doranidazole on cultured brain slices bearing implants of GSC-F cells.
Sequential images of brain slices prepared from mice bearing GSC-F cell–based orthotopic tumors and incubated with or without 3 mM doranidazole under normoxic (a) or hypoxic (b) conditions. Overlays of green fluorescence (S–G2–M phase), red fluorescence (G1 phase), and phase-contrast images are shown for days 0, 1, and 2. A DAPI exclusion assay for the same areas as well as hematoxylin-eosin (HE) staining of paraffin-embedded sections of the explants are also presented for day 2. Scale bars, 300 µm (fluorescence images) or 50 µm (hematoxylin-eosin). c Quantification of tumor area for explants as in (a, b) at days 0 and 2. Data are for explants from n = 3 mice per condition and were analyzed by two-way ANOVA followed by Sidak’s post hoc test. A.U. arbitrary units. d Model for the effects of doranidazole on GSCs in their hypoxic niche. DSB double-strand breaks. The scheme was created with biorender.com.

