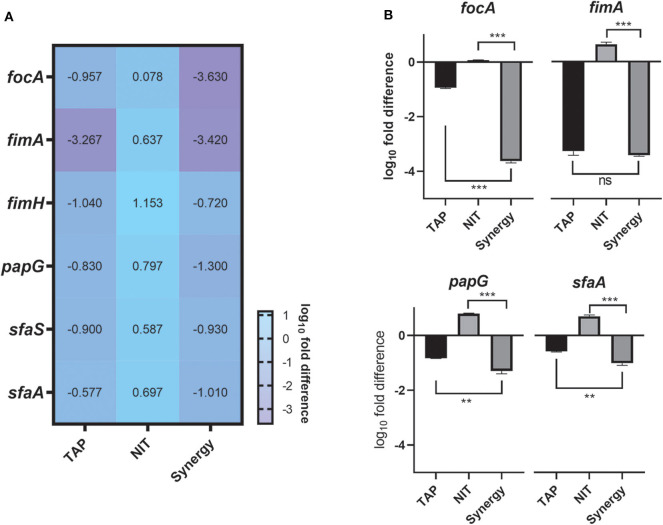
Figure 3.
Gene expression Studies. (A) Heatmap of the adhesion genes downregulated by the combination. (B) Tableau Graph that represents the fimbriae systems considered. The graph shows that the synergy treatment significantly downregulated the adhesin genes as compared to the NIT treatment. The log10fold difference of the different genes upon different treatments is depicted. All the assays were done in triplicates on different occasions. The combination treatment and TAP downregulated adhesins considered. Student unpaired t-test was used for the significance analysis. p < 0.05 was considered significant. **p ≤ 0.001 and ***p ≤ 0.0001.

