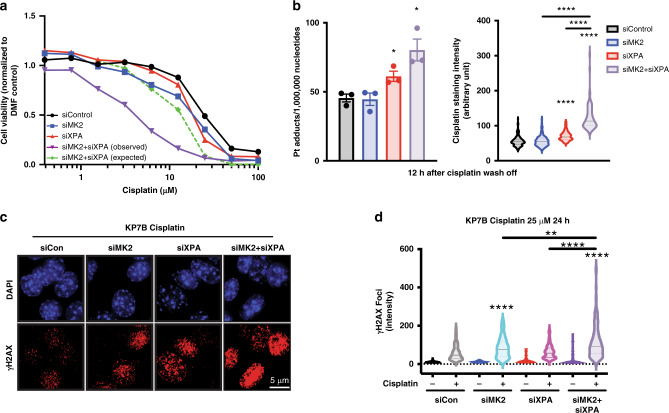
Fig. 2. Co-targeting NER and MK2 enhances cisplatin lethality in cells.
a KP7B cells were depleted of MK2, XPA, or both using siRNA, and treated with the indicated concentrations of cisplatin. Cell viability was measured 72 h later using the CellTiter-Glo luminescence assay. The expected viability following combined MK2 and XPA knockdown was calculated assuming a Bliss independence model of additivity (see section “Methods”). b KP7B cells were treated with 25 µM cisplatin for 5 h. The drug-containing media was then replaced with drug-free media, and DNA repair allowed to occur for 12 h. Residual cisplatin adducts were then quantified by atomic absorption spectroscopy (left graph; siXPA + cis vs. siCon + cis, *p = 0.0280; siMK2 + siXPA + cis vs. siCon + cis, *p = 0.0144; two-tailed unpaired t test. n = 3 experiments. Error bars represent mean ± SEM) and by immunofluorescence using an antibody against cisplatin–DNA adducts (right graph; siXPA + cis vs. siCon + cis, ****p ≤ 0.0001; siMK2 + siXPA + cis vs. siCon + cis, ****p ≤ 0.0001; siMK2 + siXPA + cis vs. siMK2 + cis, ****p ≤ 0.0001; siMK2 + siXPA + cis vs. siXPA + cis, ****p ≤ 0.0001; two-tailed unpaired t test. n = 3 separate samples n > 70 cells per condition). c Representative immunofluorescence images of KP7B cells depleted of MK2, XPA, or both proteins treated with 25 μM cisplatin for 24 h, then fixed and stained with an antibody against γH2AX. d Quantification of the number of γH2AX foci in the KP7B cells treated as in Fig. 2c for each treatment in n = 3 separate samples. (siMK2 + cis vs siCon + cis, ****p < 0.0001; siMK2 + siXPA + cis vs. siCon + cis, ****p < 0.0001; siMK2 + siXPA + cis vs. siMK2 + cis, **p ≤ 0.002; siMK2 + siXPA + cis vs. siXPA + cis, **p < 0.0001; two-tailed unpaired t test. n = 3 separate samples and n > 90 cells per condition). Width in violin plot indicates frequency for each observed value from maximum to minimum, with dotted line indicating median.

