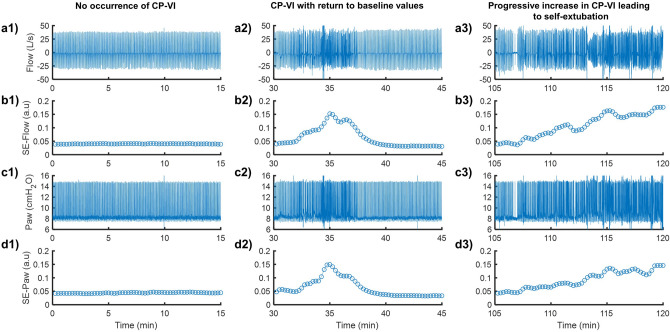
Figure 4.
Representative examples of ventilator signals for airway flow (Flow) (a1–a3) and airway pressure (Paw) (c1–c3) recorded over 15-min periods in the two hours prior to self-extubation, together with the sample entropy (SE) tracings derived from Flow (b1–b3) and Paw (d1–d3). Both, SE-Flow and SE-Paw were calculated with r = 0.2 × SD of each overlapping 30-s-long sliding window, by using different values of m equal to 2 and 4, respectively. Three 15-min periods are represented, corresponding to (1) no occurrence of CP-VI (left panel), (2) occurrence of CP-VI that returned to baseline values (middle panel), and (3) progressive increase in CP-VI leading to self-extubation. SE is highly sensitive to changes in irregularity during MV.

